



In questo articolo vedremo come costruire un sistema completo di monitoraggio della salute dei dischi SSD e NVMe installati negli host VMware ESXi, utilizzando esclusivamente strumenti open source: pyVmomi per interfacciarsi con le API vSphere, Prometheus e Pushgateway per la raccolta e lo storage delle metriche, e Grafana per la visualizzazione e gli alert.
La soluzione non richiede l’installazione di agenti sugli host ESXi, non dipende da VIB di terze parti e funziona correttamente anche con il Secure Boot abilitato.
PREREQUISITI
Uno o più host VMware ESXi gestiti da vCenter
Un server Linux con Docker e Portainer già installati
Installazione e Configurazione di Portainer su Ubuntu Server 24.04
Grafana già installato e funzionante su Docker
Installazione e Configurazione base di Grafana su Ubuntu Server 24.04
Un’istanza Gitea per il versioning dei file di configurazione
Installazione e Configurazione Base di Gitea su Ubuntu Server 24.04
Accesso amministrativo a vCenter per la creazione di un utente dedicato
ARCHITETTURA
Host ESXi 1 ──┐
Host ESXi 2 ──┤──→ vCenter API ──→ smart-exporter ──→ Pushgateway ──→ Prometheus ──→ Grafana
Host ESXi 3 ──┘ (Python/pyVmomi)
└──────────── Stack Docker ────────────┘
Lo smart-exporter è un container Python che si connette a vCenter tramite le API vSphere, itera su tutti gli host registrati, legge lo stato operativo dei dischi e pubblica le metriche sul Pushgateway. Prometheus scrape il Pushgateway periodicamente e Grafana visualizza i dati.
FASE 1 — CREAZIONE DI UN UTENTE DEDICATO SUL VCENTER
Per motivi di sicurezza è consigliabile non usare l’utente amministratore per il monitoraggio. Creare quindi un utente read-only dedicato.
Accedere a vCenter e andare su:
Administration → Single Sign-On → Users and Groups → Add
Compilare i campi:
Username: monitoring-smart
Password: scegli una password sicura
Assegnare il ruolo:
Administration → Access Control → Global Permissions
Assegnare il ruolo Read-Only all’utente monitoring-smart
Spuntare Applica a tutti gli oggetti figli
FASE 2 – STRUTTURA DEL REPOSITORY DI GITEA
Creare un nuovo repository su Gitea chiamato esxi-smart-monitoring con la seguente struttura:
esxi-smart-monitoring/
├── .gitignore
├── docker-compose.yml
└── exporter/
├── Dockerfile
├── requirements.txt
└── smart_exporter.py
FASE 3 — CREAZIONE DEI FILE DI CONFIGURAZIONE
Di seguito il contenuto del file .gitignore:
|
0 |
ssh_key/ |
Di seguito il contenuto del file exporter/requirements.txt
|
0
1
2
3
|
pyVmomi==8.0.3.0.1
prometheus-client==0.20.0
schedule==1.2.1
urllib3==2.2.1
|
Adesso creare lo script si connette a vCenter tramite pyVmomi, itera su tutti gli host ESXi registrati e per ogni host legge lo stato operativo dei dischi locali. Le metriche vengono pubblicate sul Pushgateway in formato Prometheus.
Di seguito il contenuto del file exporter/smart_exporter.py:
|
0
1
2
3
4
5
6
7
8
9
10
11
12
13
14
15
16
17
18
19
20
21
22
23
24
25
26
27
28
29
30
31
32
33
34
35
36
37
38
39
40
41
42
43
44
45
46
47
48
49
50
51
52
53
54
55
56
57
58
59
60
61
62
63
64
65
66
67
68
69
70
71
72
73
74
75
76
77
78
79
80
81
82
83
84
85
86
87
88
89
90
91
92
93
94
95
96
97
98
99
100
101
102
103
104
105
106
107
108
109
110
111
112
113
114
115
116
117
118
119
120
121
122
123
124
125
126
127
128
129
130
131
132
133
134
135
136
137
138
139
140
141
142
143
144
145
146
147
148
149
150
151
|
python#!/usr/bin/env python3
import os
import ssl
import time
import schedule
import logging
from pyVim.connect import SmartConnect, Disconnect
from pyVmomi import vim
from prometheus_client import Gauge, push_to_gateway, CollectorRegistry
logging.basicConfig(
level=logging.INFO,
format='%(asctime)s %(levelname)s %(message)s'
)
log = logging.getLogger(__name__)
VCENTER_HOST = os.environ.get('VCENTER_HOST')
VCENTER_USER = os.environ.get('VCENTER_USER')
VCENTER_PASSWORD = os.environ.get('VCENTER_PASSWORD')
VCENTER_PORT = int(os.environ.get('VCENTER_PORT', 443))
VERIFY_SSL = os.environ.get('VCENTER_SSL', 'false').lower() == 'true'
PUSHGATEWAY_URL = os.environ.get('PUSHGATEWAY_URL', 'http://pushgateway:9091')
INTERVAL_MINUTES = int(os.environ.get('INTERVAL_MINUTES', 5))
def get_vcenter_connection():
if not VERIFY_SSL:
context = ssl.SSLContext(ssl.PROTOCOL_TLS_CLIENT)
context.check_hostname = False
context.verify_mode = ssl.CERT_NONE
else:
context = ssl.create_default_context()
return SmartConnect(
host=VCENTER_HOST,
user=VCENTER_USER,
pwd=VCENTER_PASSWORD,
port=VCENTER_PORT,
sslContext=context
)
def get_all_hosts(content):
container = content.viewManager.CreateContainerView(
content.rootFolder,
[vim.HostSystem],
recursive=True
)
hosts = list(container.view)
container.Destroy()
return hosts
def collect_smart_metrics():
log.info("Starting SMART collection cycle")
try:
si = get_vcenter_connection()
content = si.RetrieveContent()
hosts = get_all_hosts(content)
log.info(f"Found {len(hosts)} ESXi hosts")
for host in hosts:
host_name = host.name
log.info(f"Processing host: {host_name}")
try:
storage_system = host.configManager.storageSystem
devices = storage_system.storageDeviceInfo.scsiLun
registry = CollectorRegistry()
smart_health = Gauge(
'esxi_smart_health',
'SMART health status (1=OK, 0=FAIL)',
['host', 'device', 'device_name'],
registry=registry
)
device_is_ssd = Gauge(
'esxi_device_is_ssd',
'Whether the device is an SSD (1=SSD, 0=HDD)',
['host', 'device', 'device_name'],
registry=registry
)
for device in devices:
dev_id = device.canonicalName if hasattr(device, 'canonicalName') else device.uuid
dev_name = device.displayName if hasattr(device, 'displayName') else dev_id
log.info(f" Device: {dev_name} ({dev_id})")
# Rileva se SSD
is_ssd = getattr(device, 'ssd', False)
device_is_ssd.labels(
host=host_name,
device=dev_id,
device_name=dev_name
).set(1 if is_ssd else 0)
# Leggi stato operativo
try:
op_state = getattr(device, 'operationalState', [])
health_ok = 1
if op_state:
for state in op_state:
if 'degraded' in str(state).lower() or \
'error' in str(state).lower():
health_ok = 0
break
smart_health.labels(
host=host_name,
device=dev_id,
device_name=dev_name
).set(health_ok)
log.info(f" Health: {'OK' if health_ok else 'FAIL'}")
except Exception as e:
log.warning(f" Could not get health for {dev_id}: {e}")
continue
push_to_gateway(
PUSHGATEWAY_URL,
job='esxi_smart',
grouping_key={'host': host_name},
registry=registry
)
log.info(f" → Pushed metrics for host {host_name}")
except Exception as e:
log.error(f"Error processing host {host_name}: {e}")
continue
Disconnect(si)
log.info("Collection cycle completed")
except Exception as e:
log.error(f"Failed to connect to vCenter: {e}")
if __name__ == '__main__':
log.info(f"Starting ESXi SMART exporter, interval: {INTERVAL_MINUTES} min")
log.info(f"vCenter: {VCENTER_HOST}, Pushgateway: {PUSHGATEWAY_URL}")
collect_smart_metrics()
schedule.every(INTERVAL_MINUTES).minutes.do(collect_smart_metrics)
while True:
schedule.run_pending()
time.sleep(30)
|
Di seguito il contenuto del file exporter/Dockerfile:
|
0
1
2
3
4
5
6
7
8
9
|
dockerfileFROM python:3.12-slim
WORKDIR /app
COPY requirements.txt /app/requirements.txt
RUN pip install --no-cache-dir -r requirements.txt
COPY smart_exporter.py /app/smart_exporter.py
CMD ["python", "-u", "/app/smart_exporter.py"]
|
La configurazione vCenter viene passata tramite variabili d’ambiente, evitando così problemi di bind mount. La configurazione di Prometheus viene iniettata tramite Docker configs, una funzionalità nativa di Docker Compose che non richiede file sul disco dell’host.
Di seguito il contenuto del file docker-compose.yml:
|
0
1
2
3
4
5
6
7
8
9
10
11
12
13
14
15
16
17
18
19
20
21
22
23
24
25
26
27
28
29
30
31
32
33
34
35
36
37
38
39
40
41
42
43
44
45
46
47
48
49
50
51
52
53
54
55
56
57
58
59
60
61
62
63
64
65
|
yamlversion: '3.8'
services:
pushgateway:
image: prom/pushgateway:latest
container_name: pushgateway
restart: unless-stopped
ports:
- "9091:9091"
networks:
- esxi_monitoring
prometheus:
image: prom/prometheus:latest
container_name: prometheus
restart: unless-stopped
ports:
- "9090:9090"
volumes:
- prometheus_data:/prometheus
configs:
- source: prometheus_config
target: /etc/prometheus/prometheus.yml
command:
- '--config.file=/etc/prometheus/prometheus.yml'
- '--storage.tsdb.retention.time=30d'
networks:
- esxi_monitoring
smart-exporter:
build: ./exporter
container_name: smart-exporter
restart: unless-stopped
environment:
- VCENTER_HOST=vcenter.dominio.local
- VCENTER_USER=monitoring-smart@dominio.local
- VCENTER_PASSWORD=la-tua-password
- VCENTER_PORT=443
- VCENTER_SSL=false
- PUSHGATEWAY_URL=http://pushgateway:9091
- INTERVAL_MINUTES=5
depends_on:
- pushgateway
networks:
- esxi_monitoring
configs:
prometheus_config:
content: |
global:
scrape_interval: 60s
evaluation_interval: 60s
scrape_configs:
- job_name: 'pushgateway'
honor_labels: true
static_configs:
- targets: ['pushgateway:9091']
volumes:
prometheus_data:
networks:
esxi_monitoring:
driver: bridge
|
NOTA BENE: sostituire le variabili VCENTER_HOST, VCENTER_USER e VCENTER_PASSWORD con i valori reali del tuo ambiente.
FASE 4 — COLLEGARE GRAFANA ALLA NETWORK DI PROMETHEUS
Poiché Grafana è già installato in uno stack Docker separato, dobbiamo collegarla alla network esxi_monitoring affinché possa raggiungere Prometheus per nome container.
Eseguire il comando:
|
0 |
docker network connect <nome_stack>_esxi_monitoring grafana
|
Verificare che la connessione funzioni con il comando:
|
0 |
docker exec -it grafana wget -qO- http://prometheus:9090/-/healthy
|
Se è tutto OK la risposta dovrebbe essere:
|
0 |
Prometheus Server is Healthy.
|
NOTA BENE: questa connessione va persa al riavvio del container. Per renderla permanente aggiungi la network esxi_monitoring come esterna nel docker-compose.yml dello stack Grafana.
FASE 5 — DEPLOY SU PORTAINER
Su Portainer creare un nuovo stack collegato al repository Gitea:
Stacks → Add stack → Repository
Repository URL: http://<IP_GITEA>/<utente>/esxi-smart-monitoring
Compose path: docker-compose.yml
Cliccare Deploy the stack
Verificare che tutti i container siano in stato Running con il comando:
|
0 |
docker ps --format "table {{.Names}}\t{{.Status}}" | grep -E "prometheus|smart|pushgateway"
|
Dovremmo visualizzare un output simile al seguente:
|
0
1
2
|
smart-exporter Up 1 days
prometheus Up 1 days
pushgateway Up 1 days
|
Controllare i log dello smart-exporter per verificare la connessione a vCenter con il comando:
|
0 |
docker logs smart-exporter --tail 30
|
L’output atteso dovrebbe essere simile al seguente:
|
0
1
2
3
4
5
6
7
8
|
2026-01-01 10:00:00,000 INFO Starting ESXi SMART exporter, interval: 5 min
2026-01-01 10:00:00,000 INFO vCenter: vcenter.dominio.local, Pushgateway: http://pushgateway:9091
2026-01-01 10:00:00,000 INFO Starting SMART collection cycle
2026-01-01 10:00:00,000 INFO Found 4 ESXi hosts
2026-01-01 10:00:00,000 INFO Processing host: esxi01.dominio.local
2026-01-01 10:00:00,000 INFO Device: Local NVMe Disk (...) (...)
2026-01-01 10:00:00,000 INFO Health: OK
2026-01-01 10:00:00,000 INFO → Pushed metrics for host esxi01.dominio.local
2026-01-01 10:00:00,000 INFO Collection cycle completed
|
FASE 6 – CONFIGURAZIONE DELLE DASHBOARD SU GRAFANA
Di seguito i vari step da seguire per la realizzazione della Dashboard.
STEP 1 — VERIFICA DEL DATASCOURCE DI PROMETHEUS
Aprire Grafana nel browser
Nel menu a sinistra cliccare Connections (icona a forma di fulmine)
Cliccare Data sources
Cercare Prometheus nella lista e cliccrci sopra
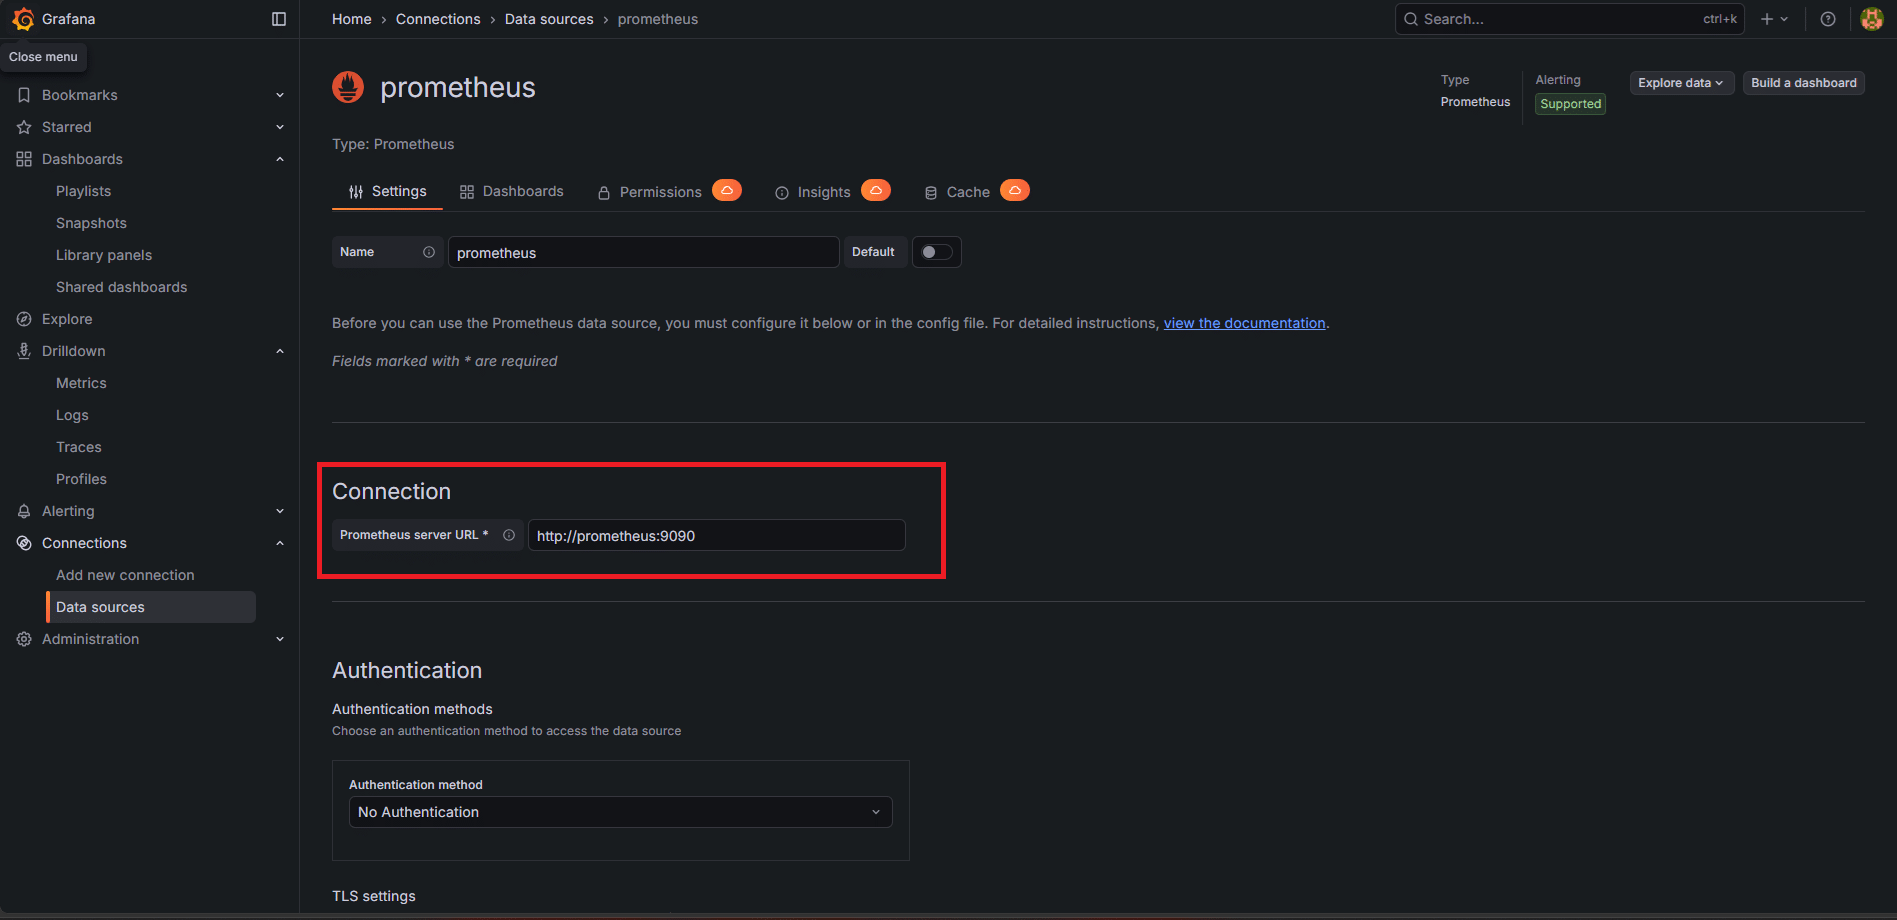
Verificare che l’URL sia http://prometheus:9090
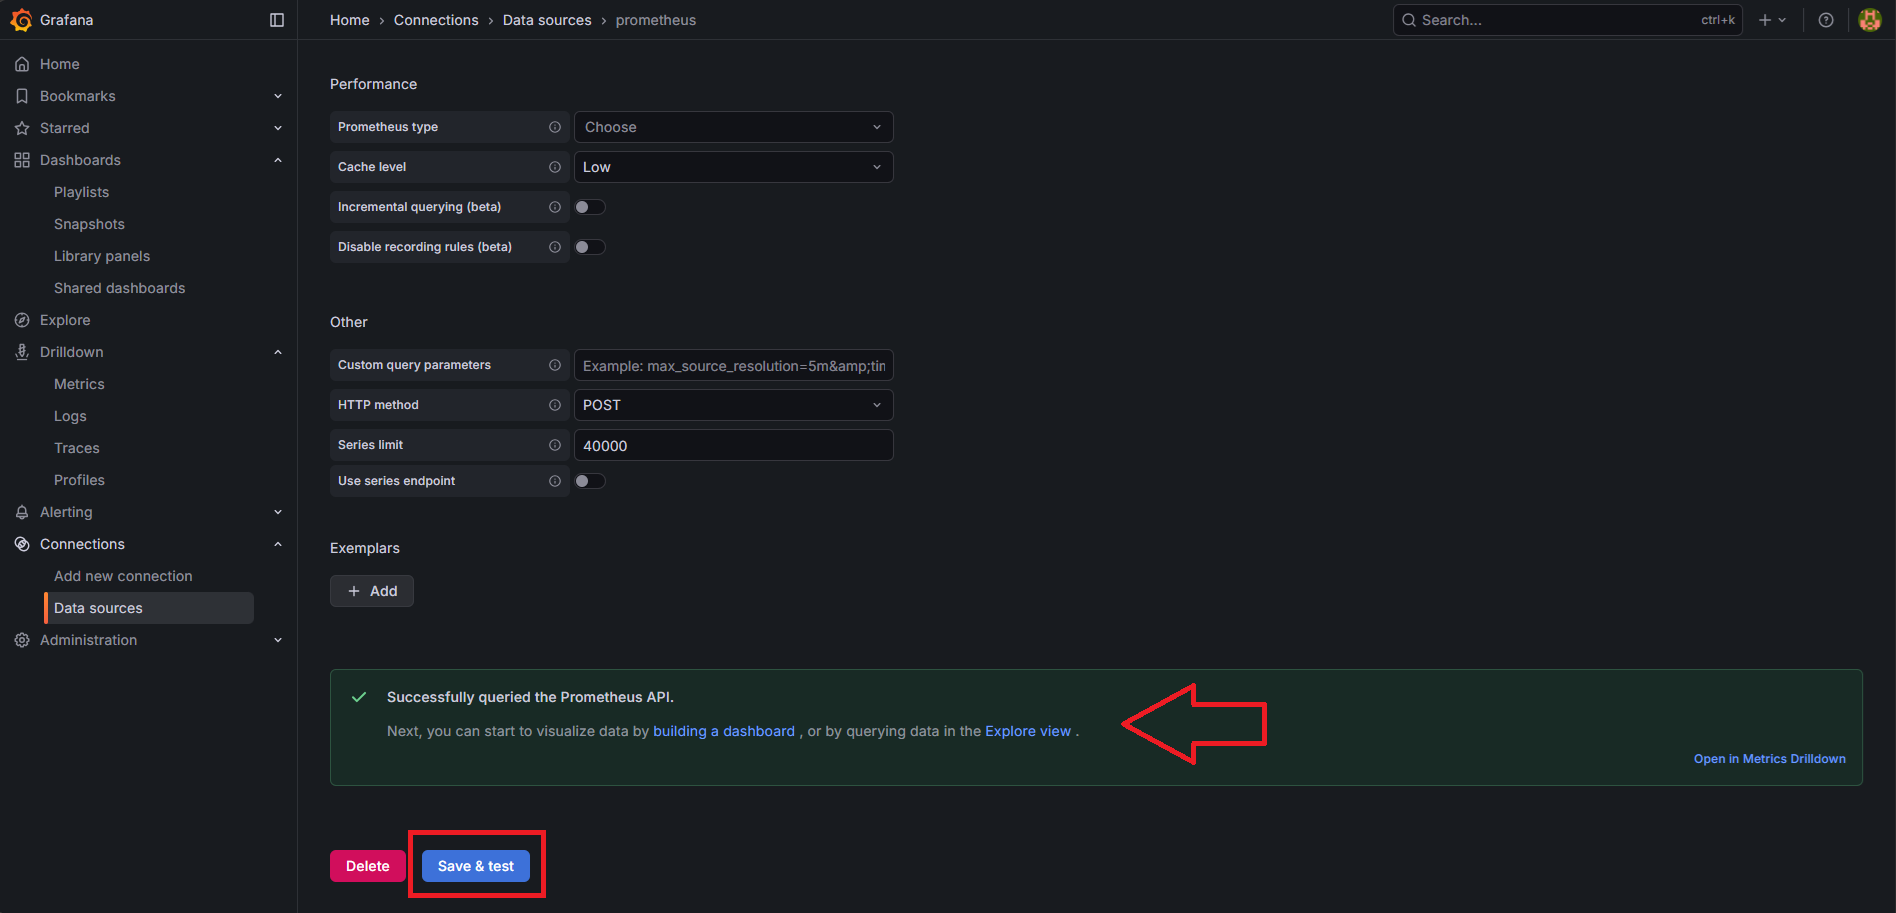
Scorrere in fondo alla pagina e cliccare Save & Test
Dovrebbe apparire il banner verde Successfully queried the Prometheus API
STEP 2 — CREARE UNA NUOVA DASHBOARD
Adesso procedere con la creazione della Dashboard
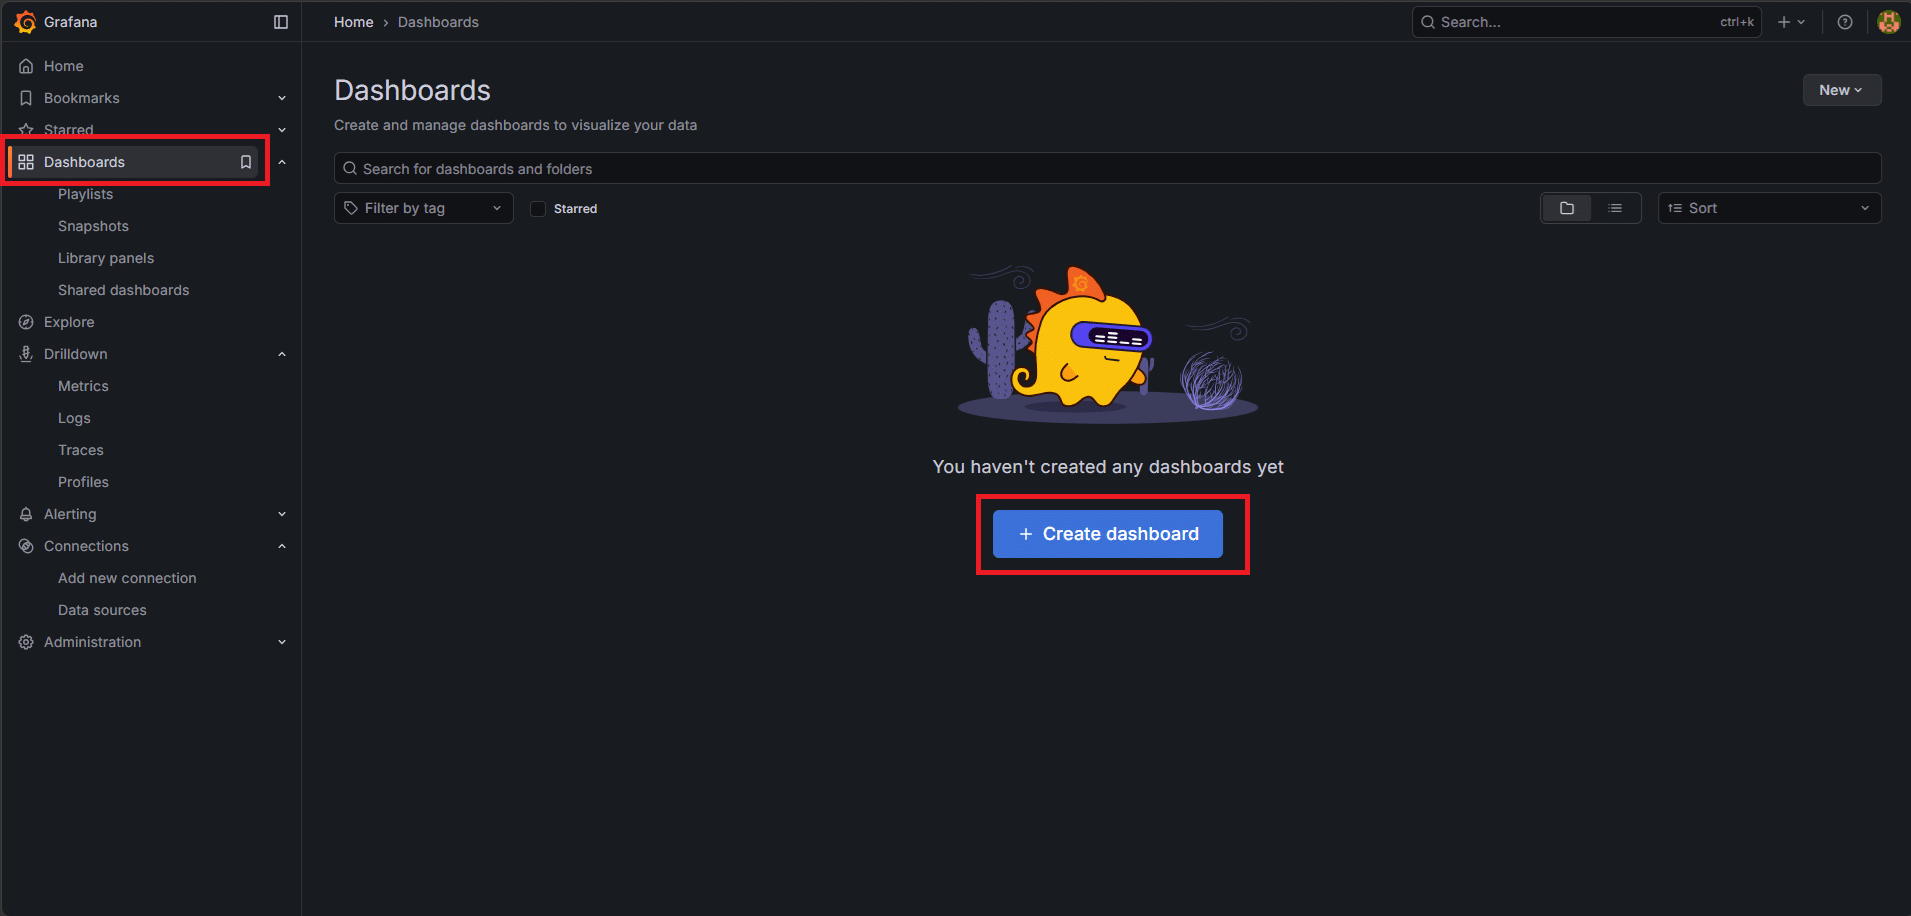
Nel menu a sinistra cliccare Dashboards quindi cliccare il pulsante blu Create Dashboard
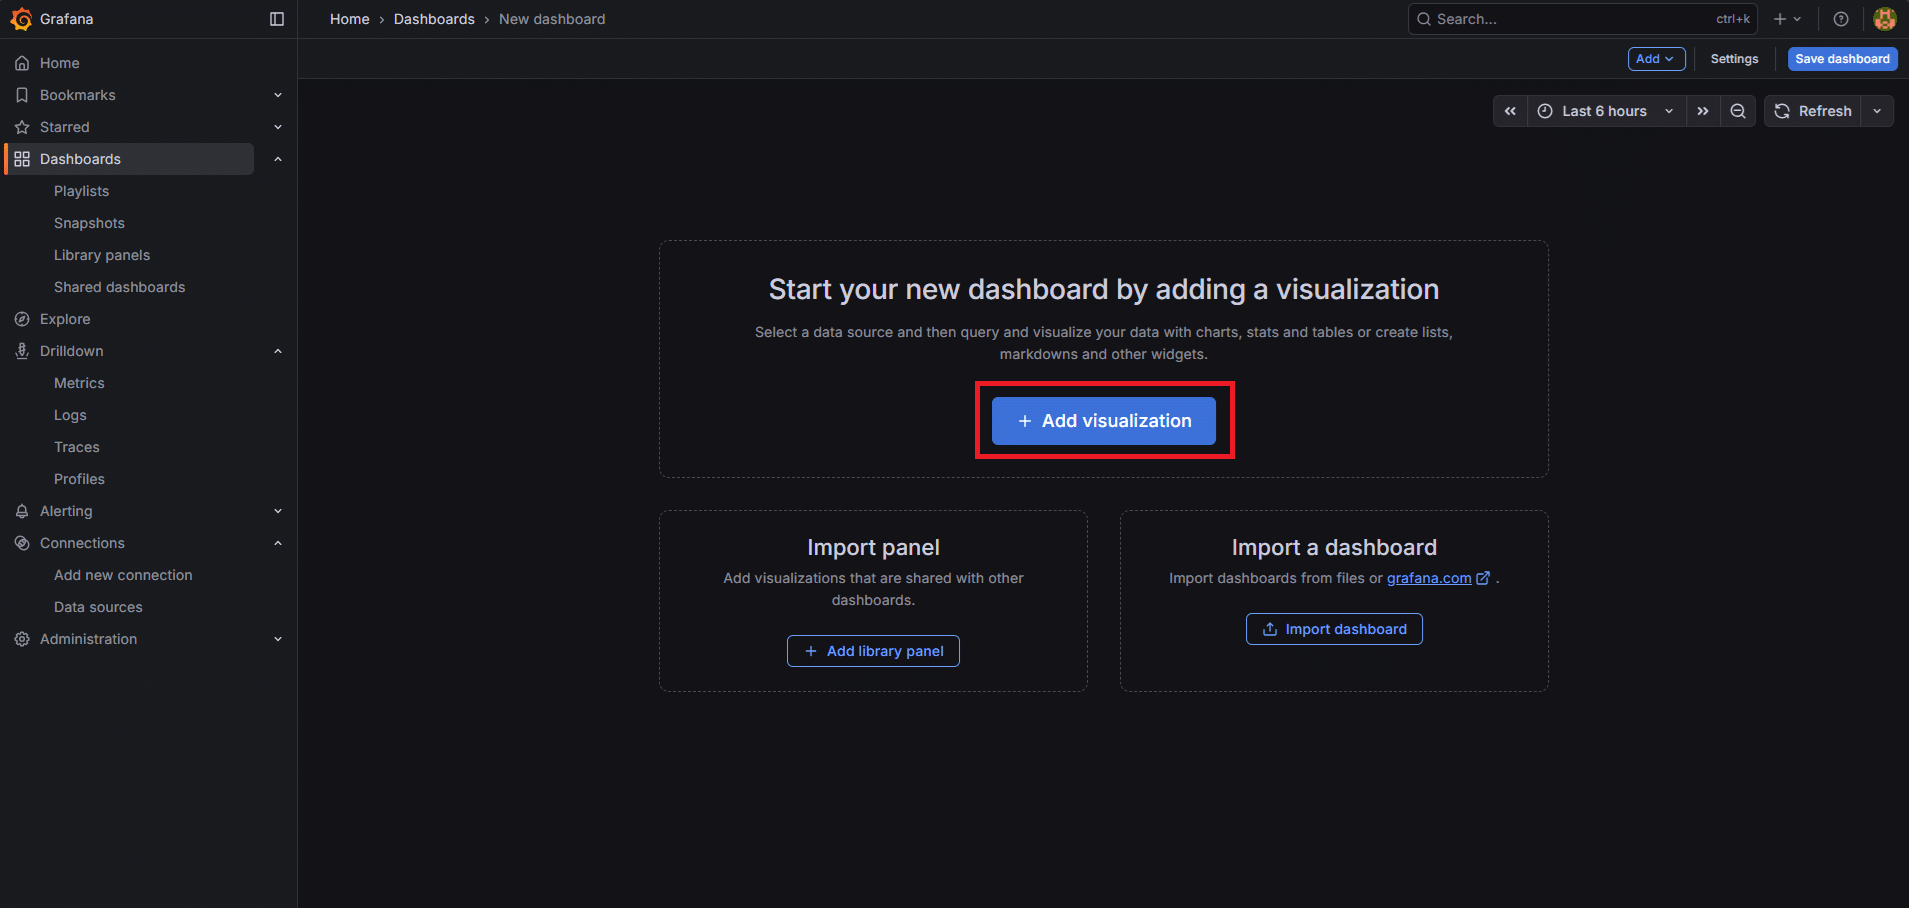
Cliccare Add visualization
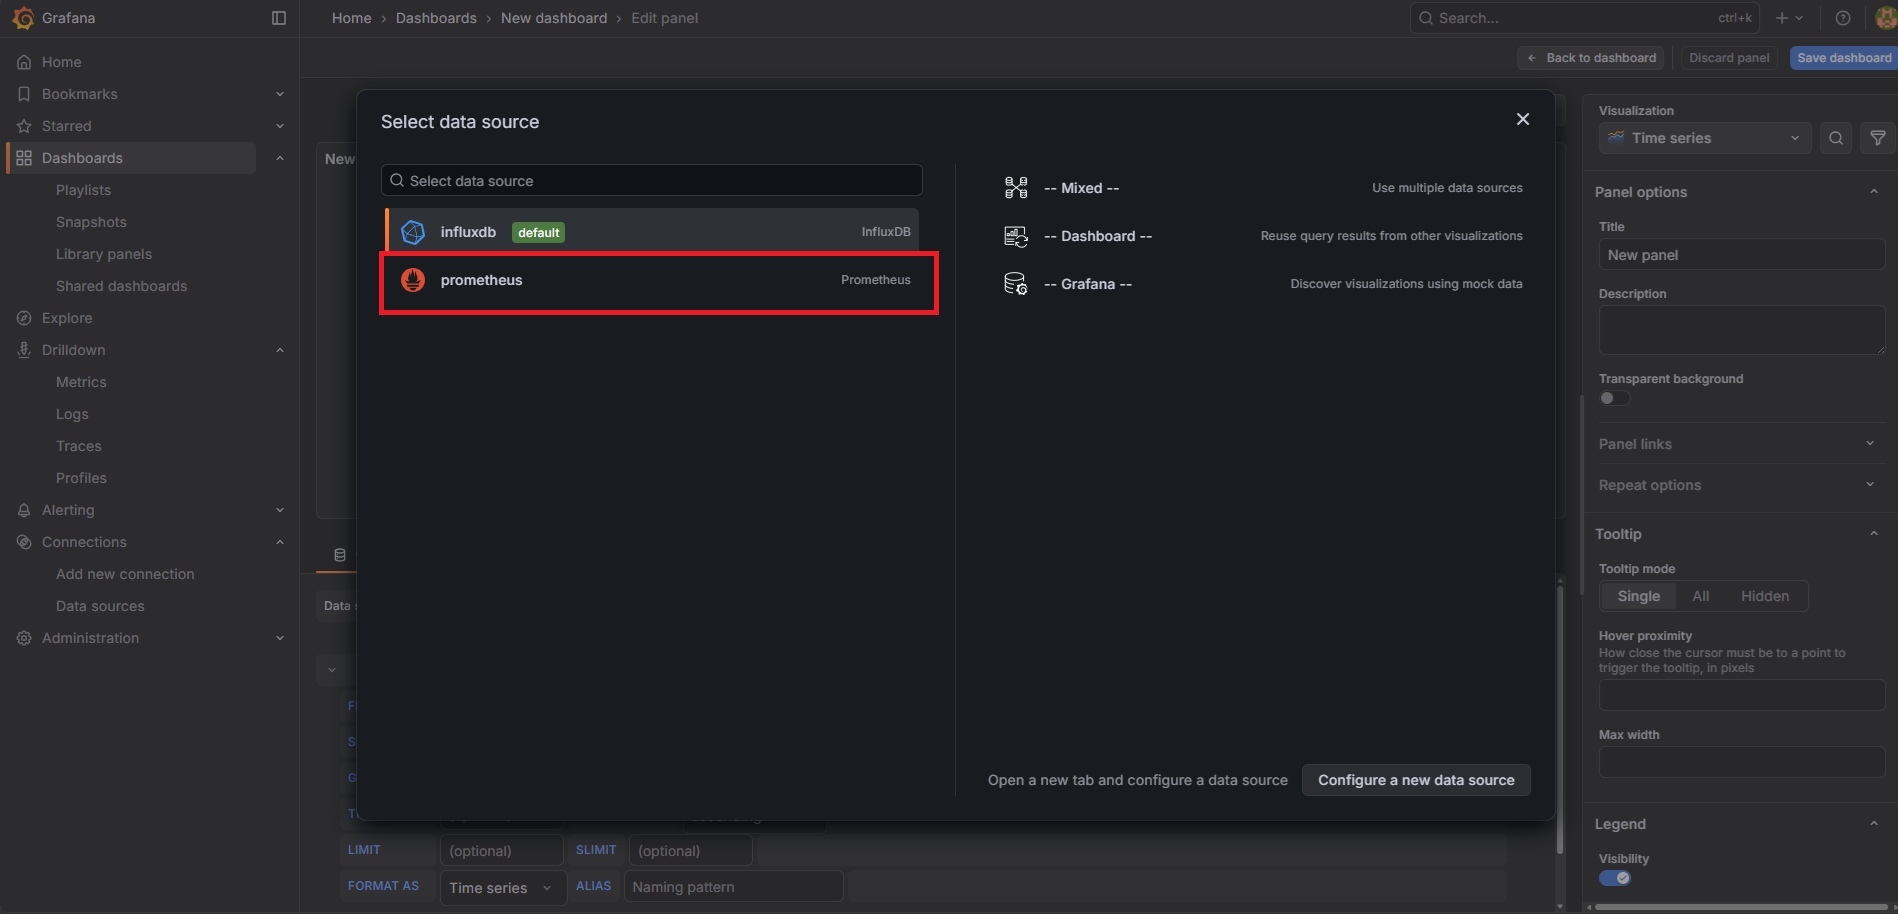
Selezionare il datasource Prometheus
STEP 3 — PANNELLO 1: HEALTH STATUS
Si apre l’editor del pannello. Procedere così:
Tipo grafico (in alto a destra):
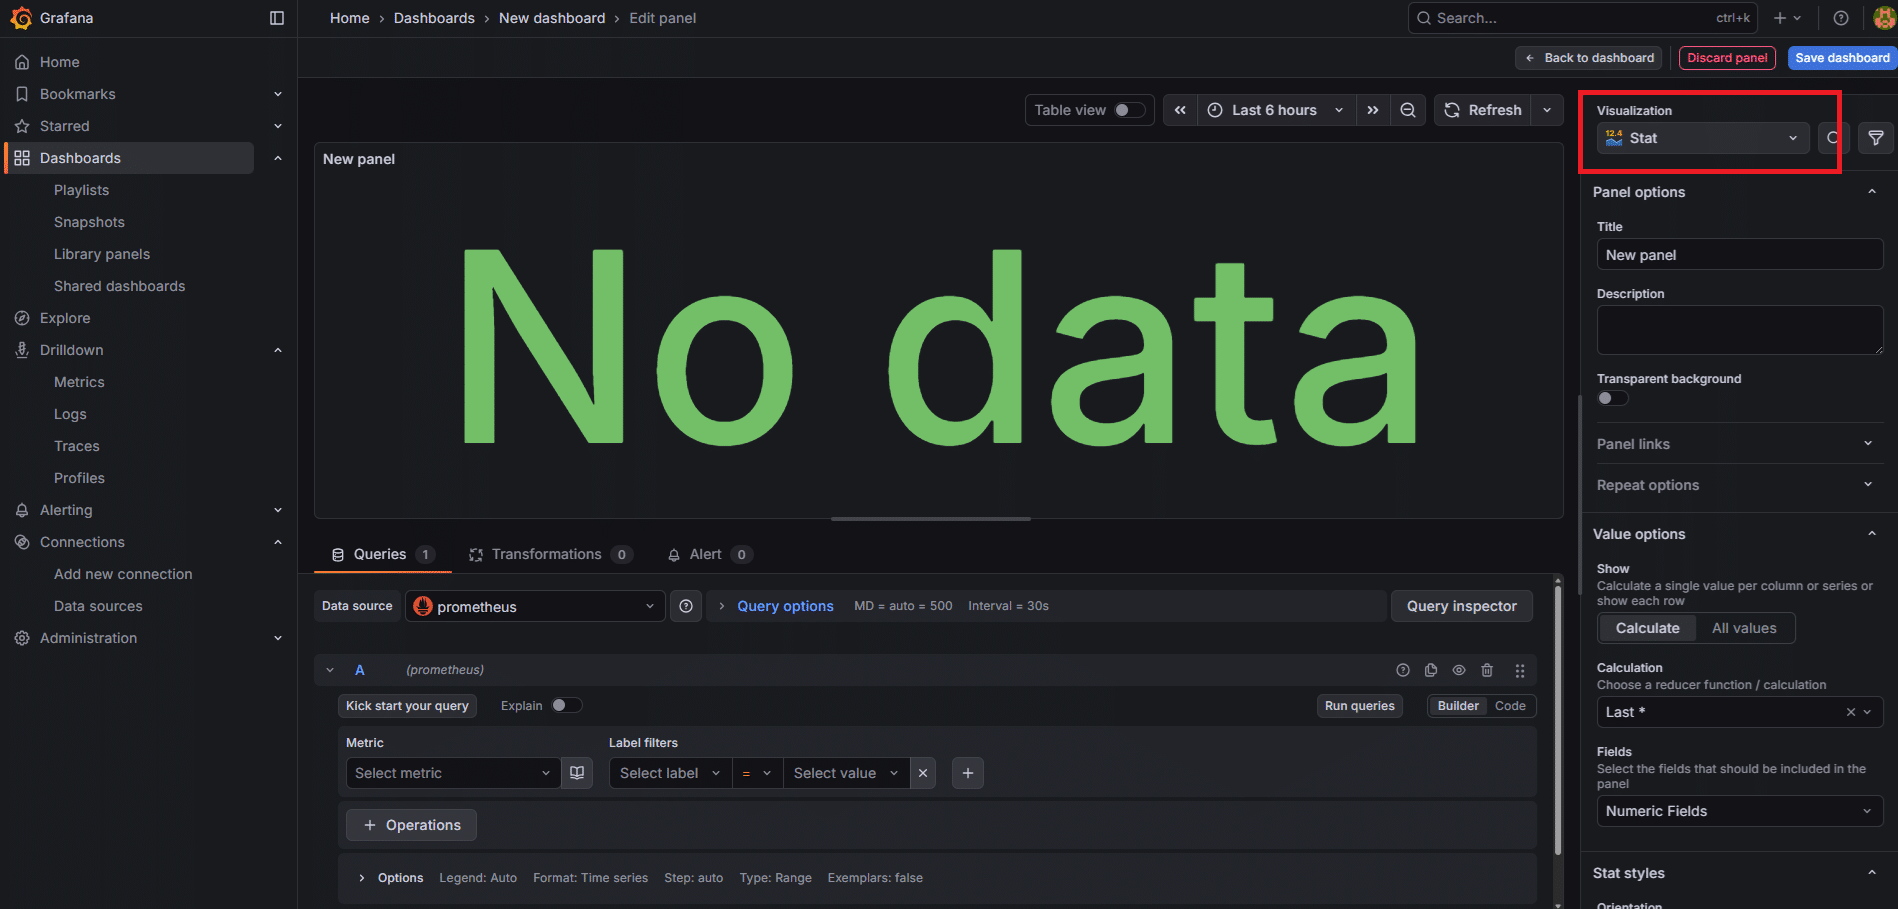
Cambiare da Time series a Stat come nell’immagine sovrastante
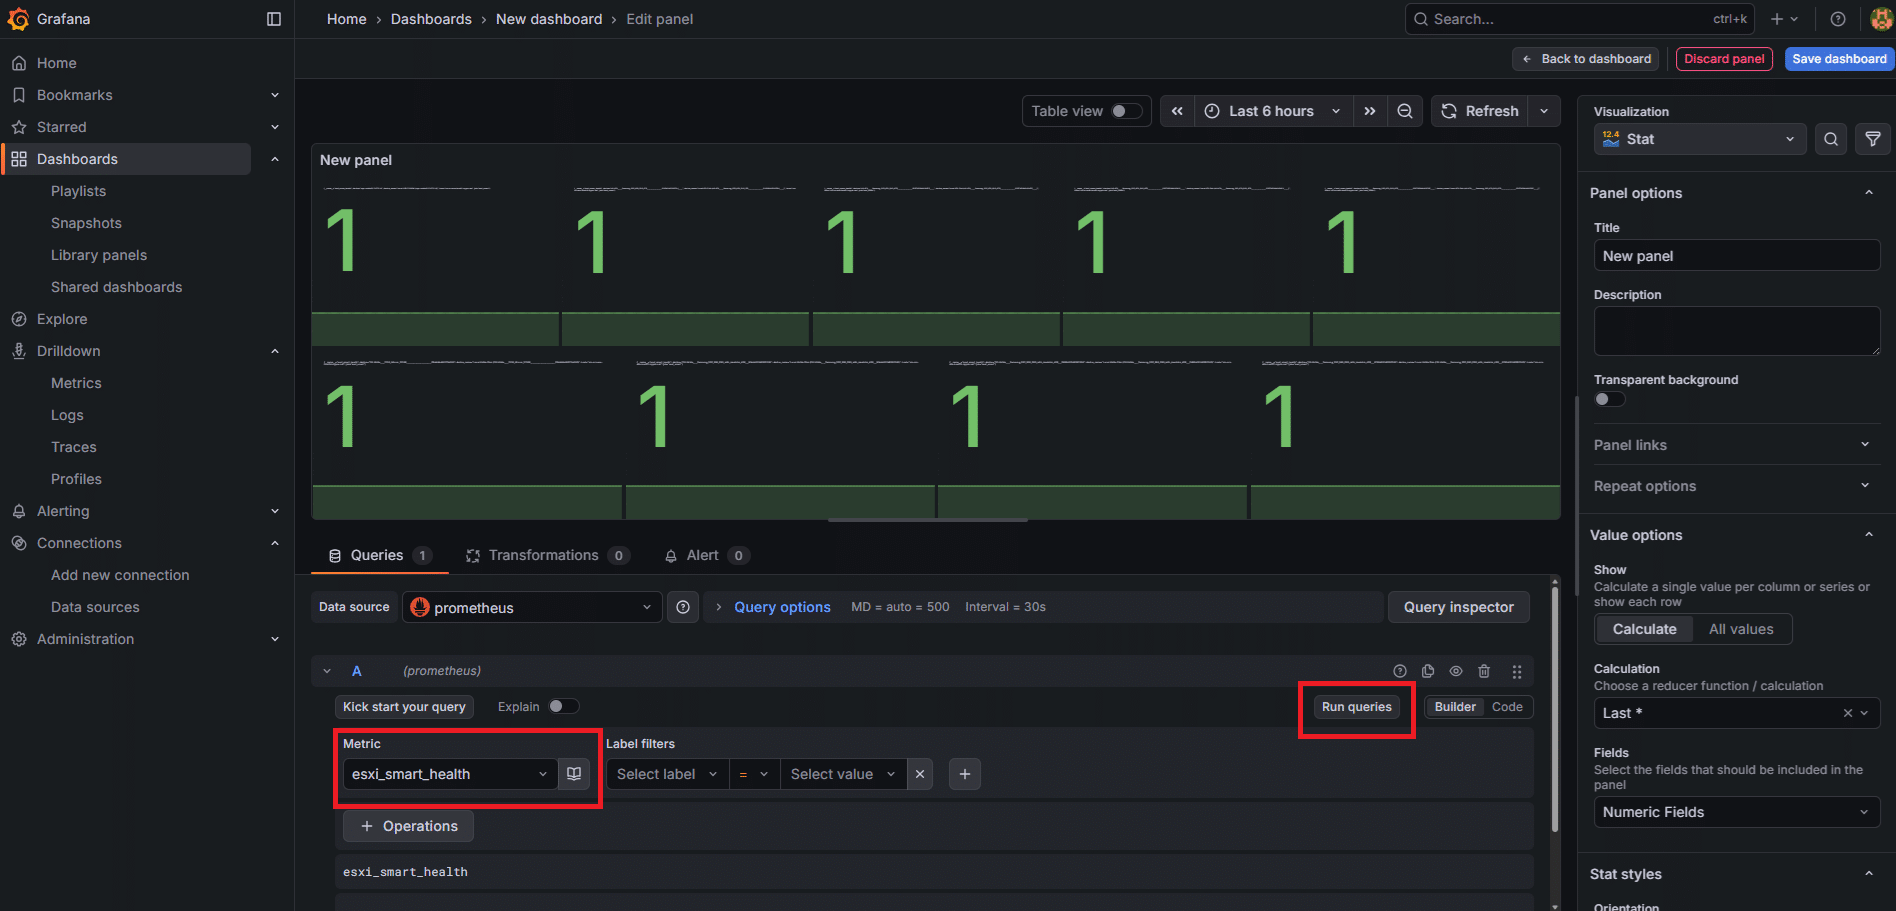
Impostare la Query (in basso):
Nel campo query selezionare la voce: esxi_smart_health
Cliccare Run queries
Dovresti vedere dei valori 0 o 1 apparire nell’anteprima.
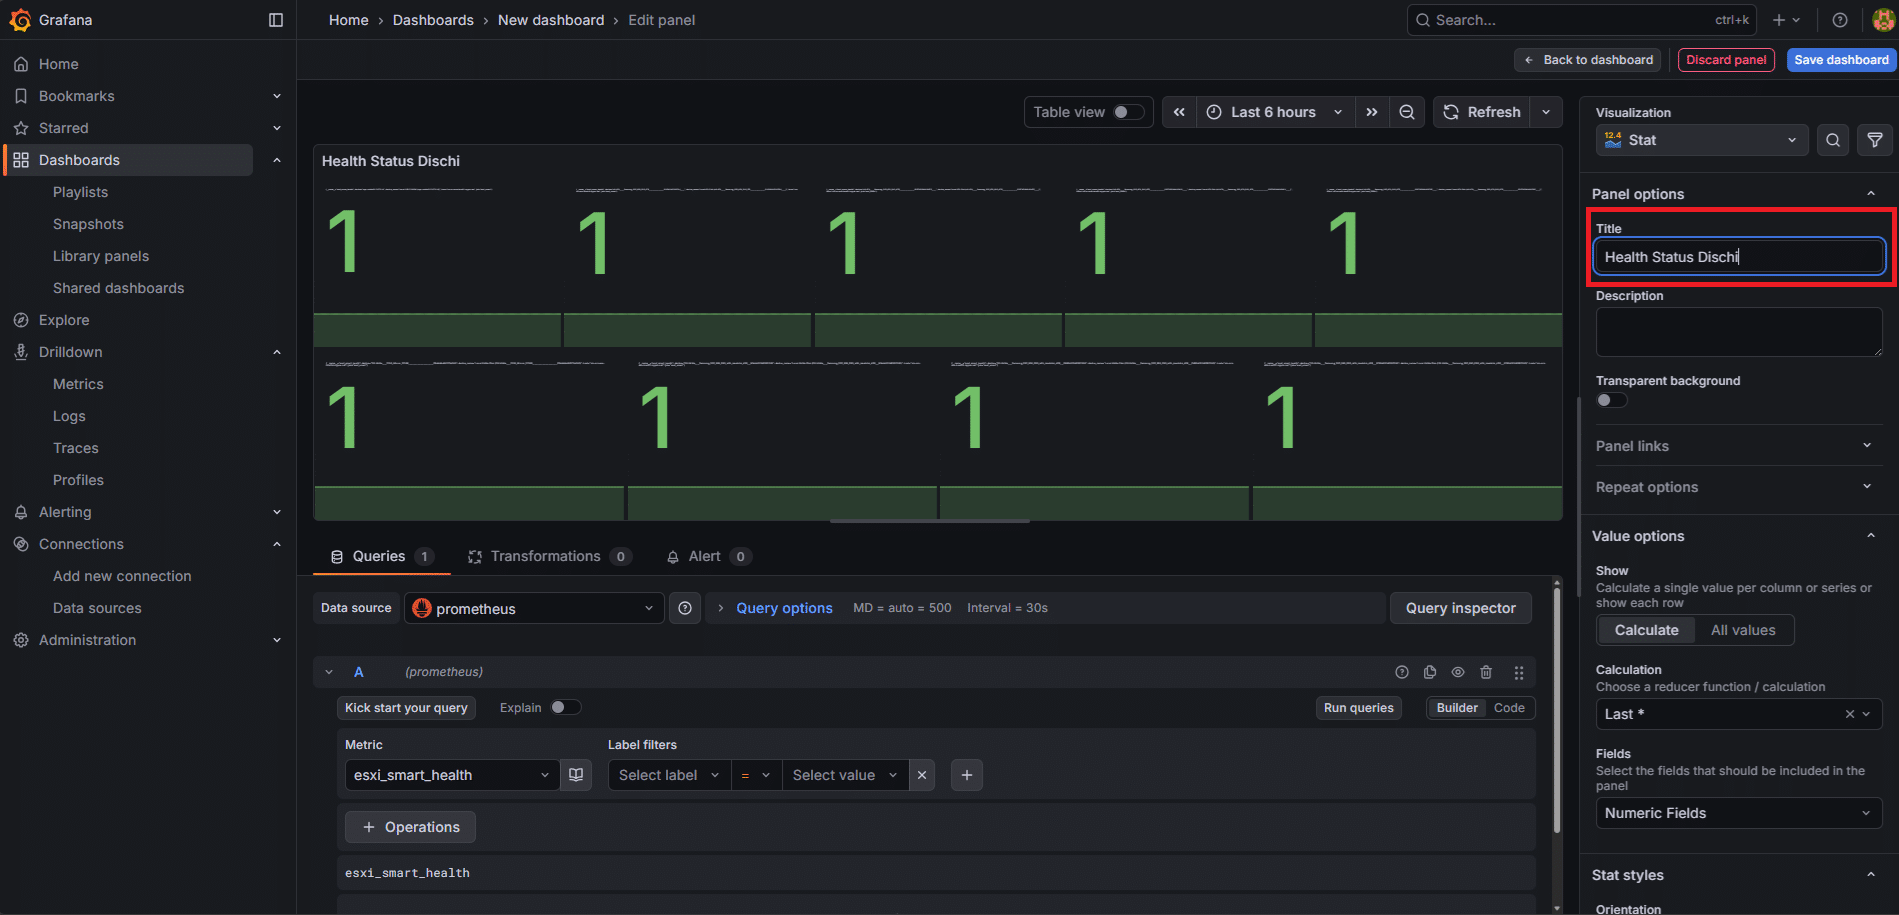
Inserire il Titolo nella colonna destra nel campo Title:
Health Status Dischi
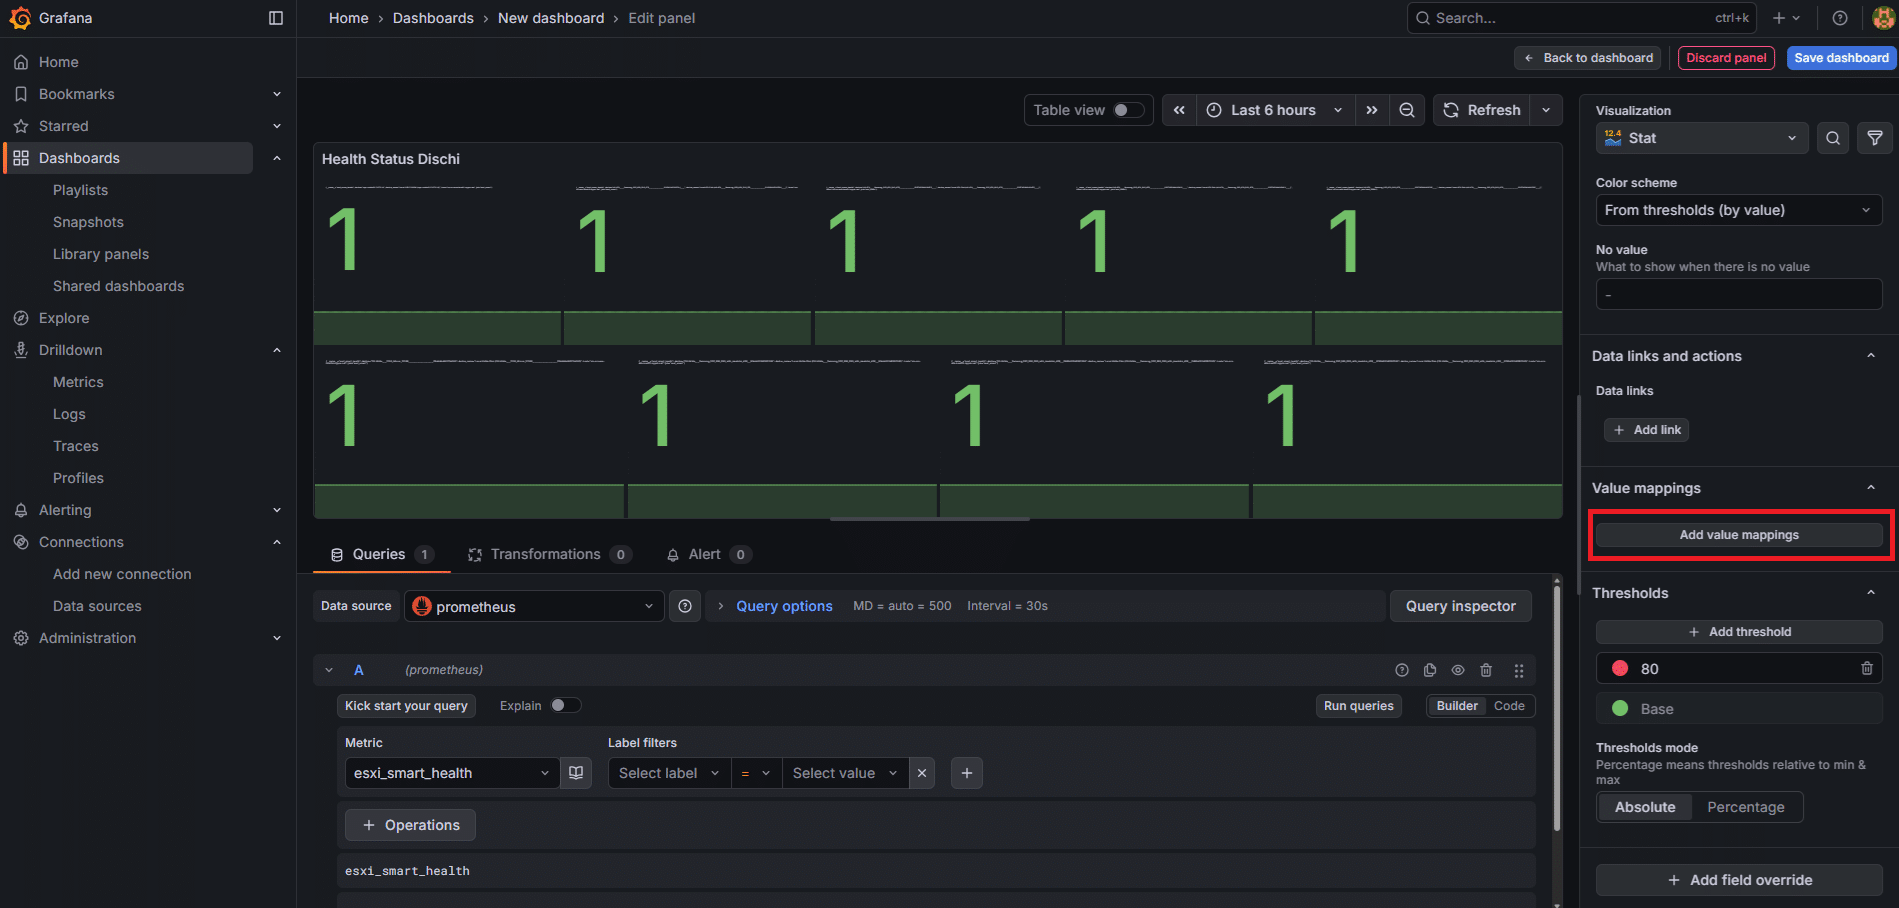
Nella colonna destra scorrere fino a Value mappings quindi cliccare su Add value mapping
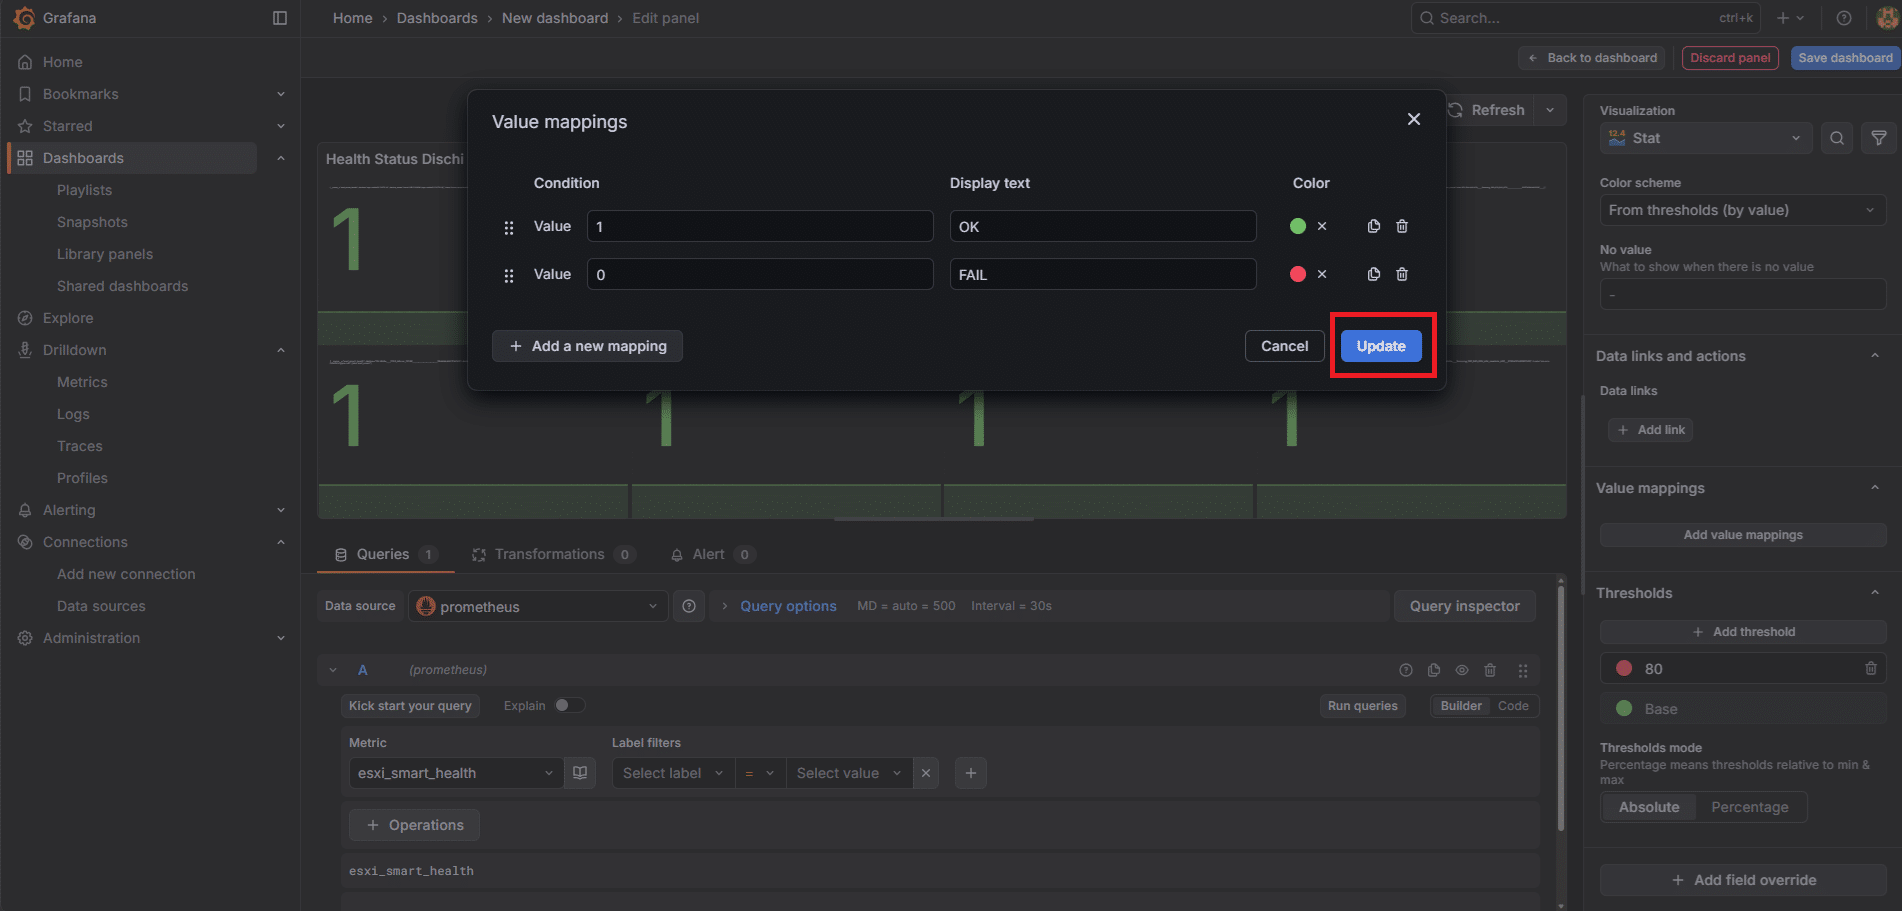
Tipo: Value
Value: 1 → Display text: OK → Color: Verde
Clicca Add value mapping di nuovo
Value: 0 → Display text: FAIL → Color: Rosso
Cliccare Update
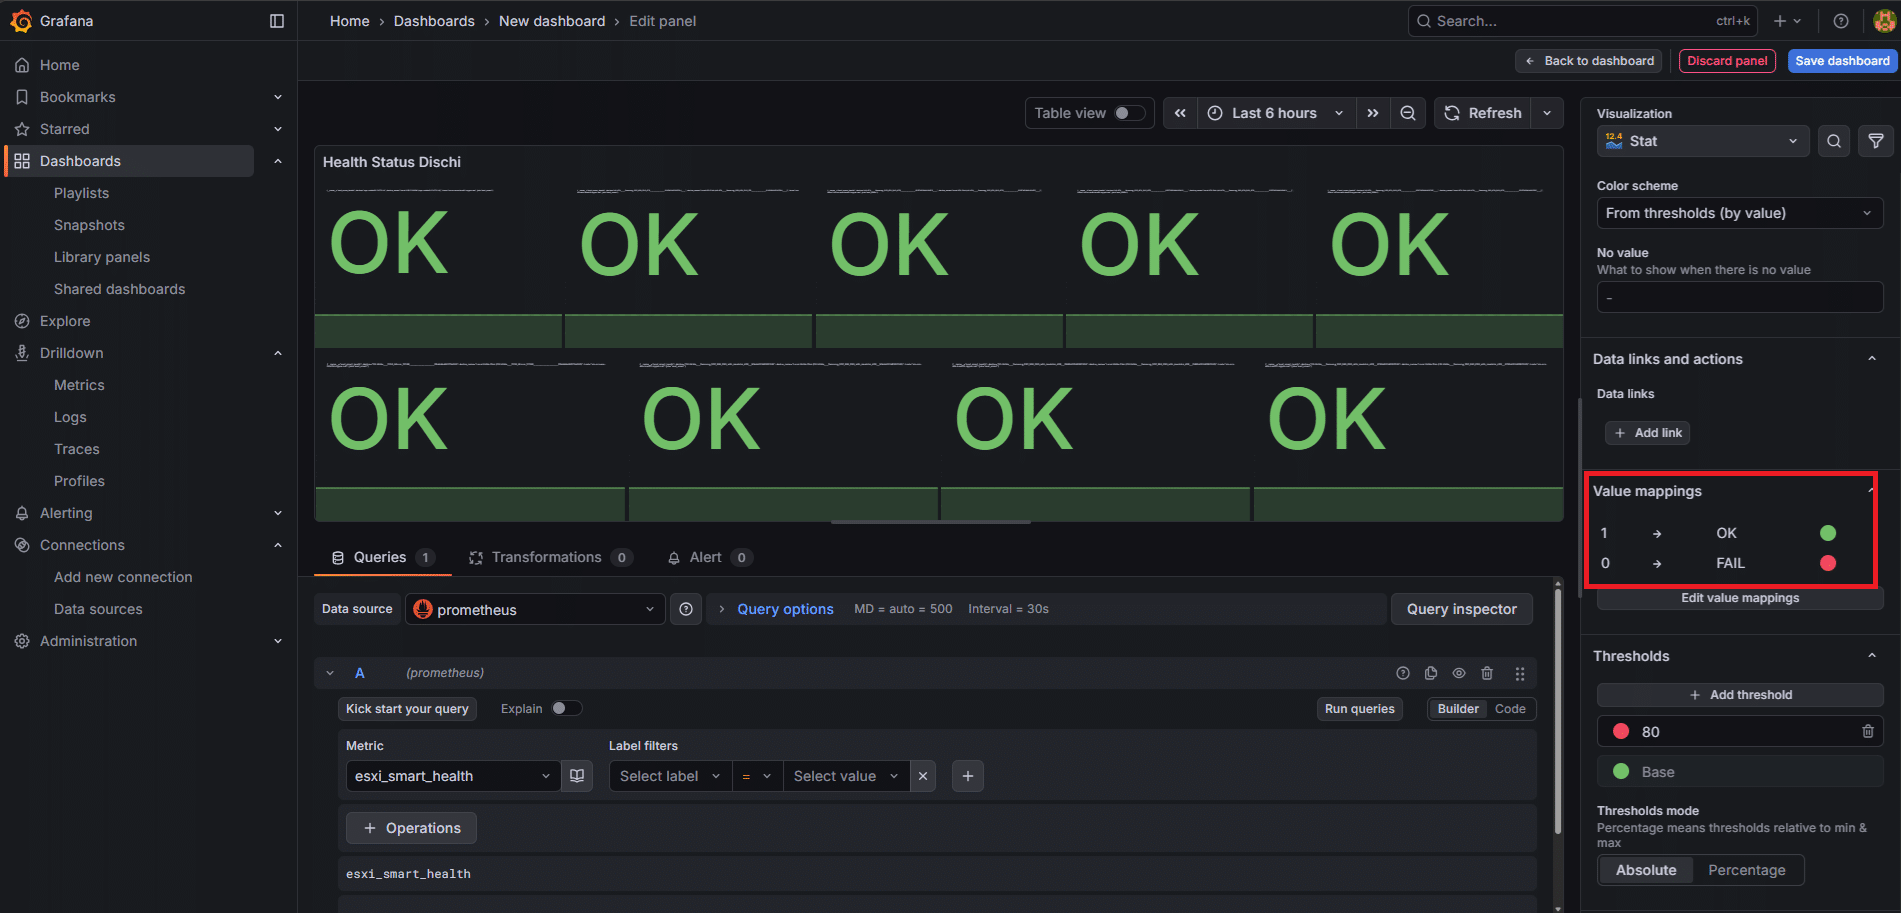
Se è tutto corretto dovremmo vedere una schermata come quella sovrastante
Adesso andare al fondo della colonna destra fino a Thresholds
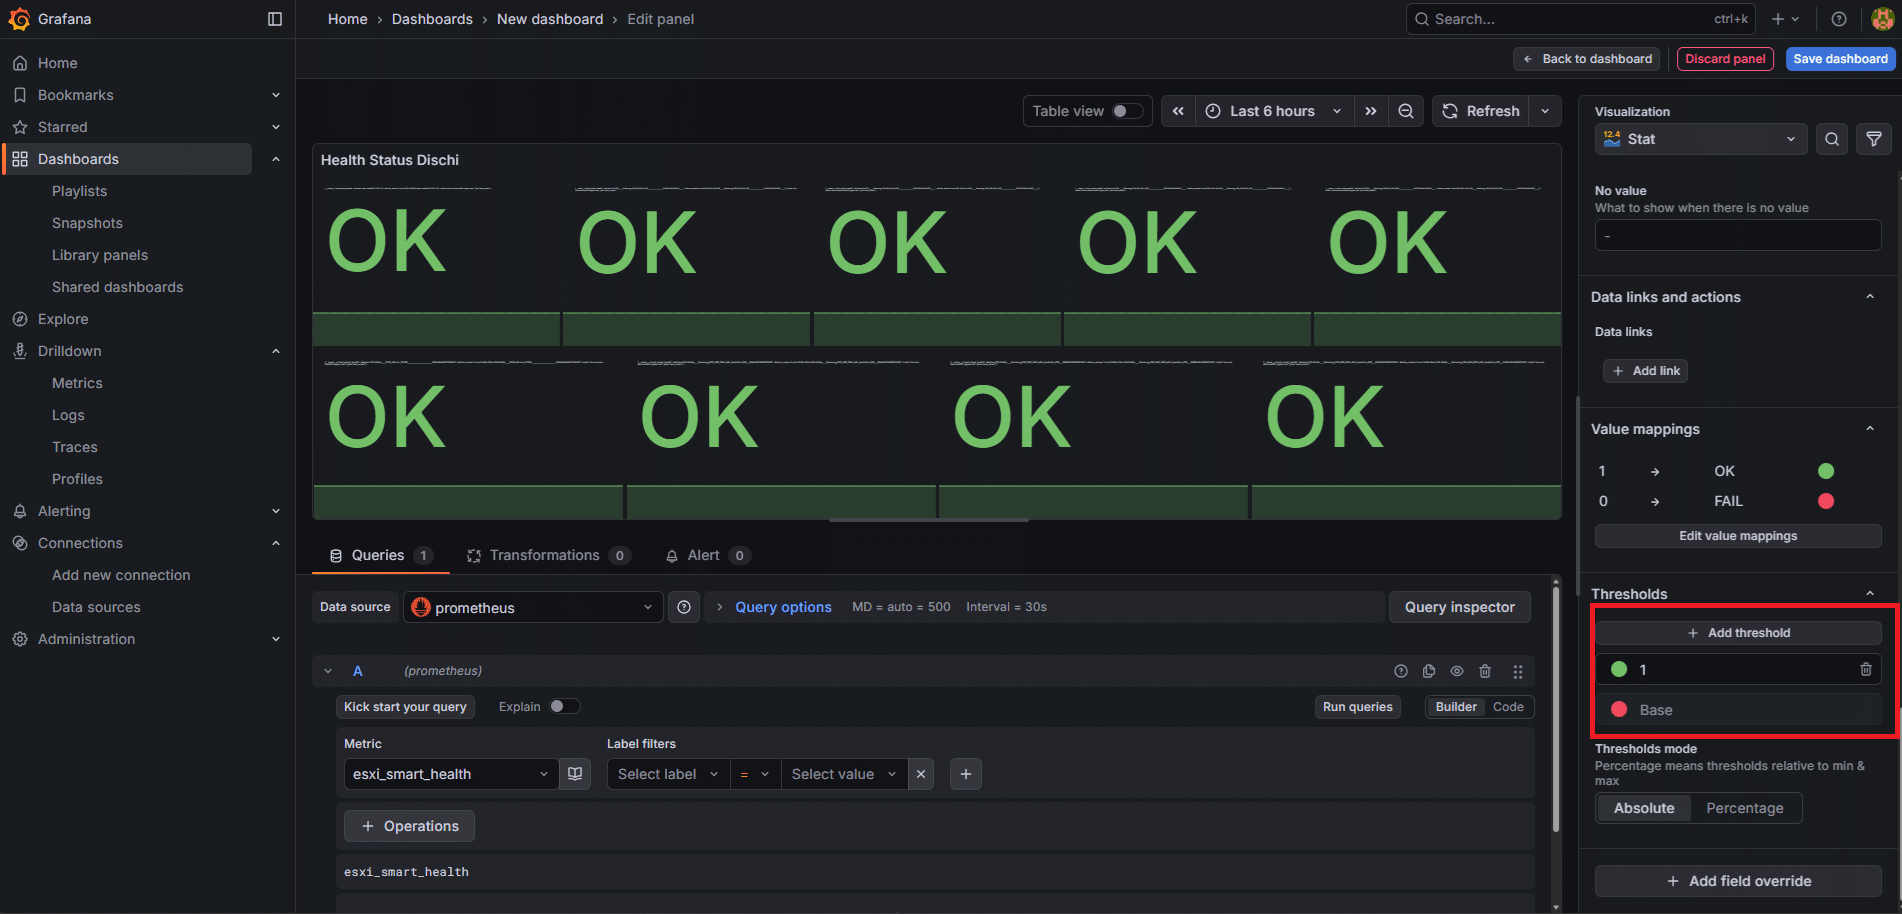
Impostare:
Base → Rosso
Aggiungi soglia: 1 → Verde
Individuare le Standard options:
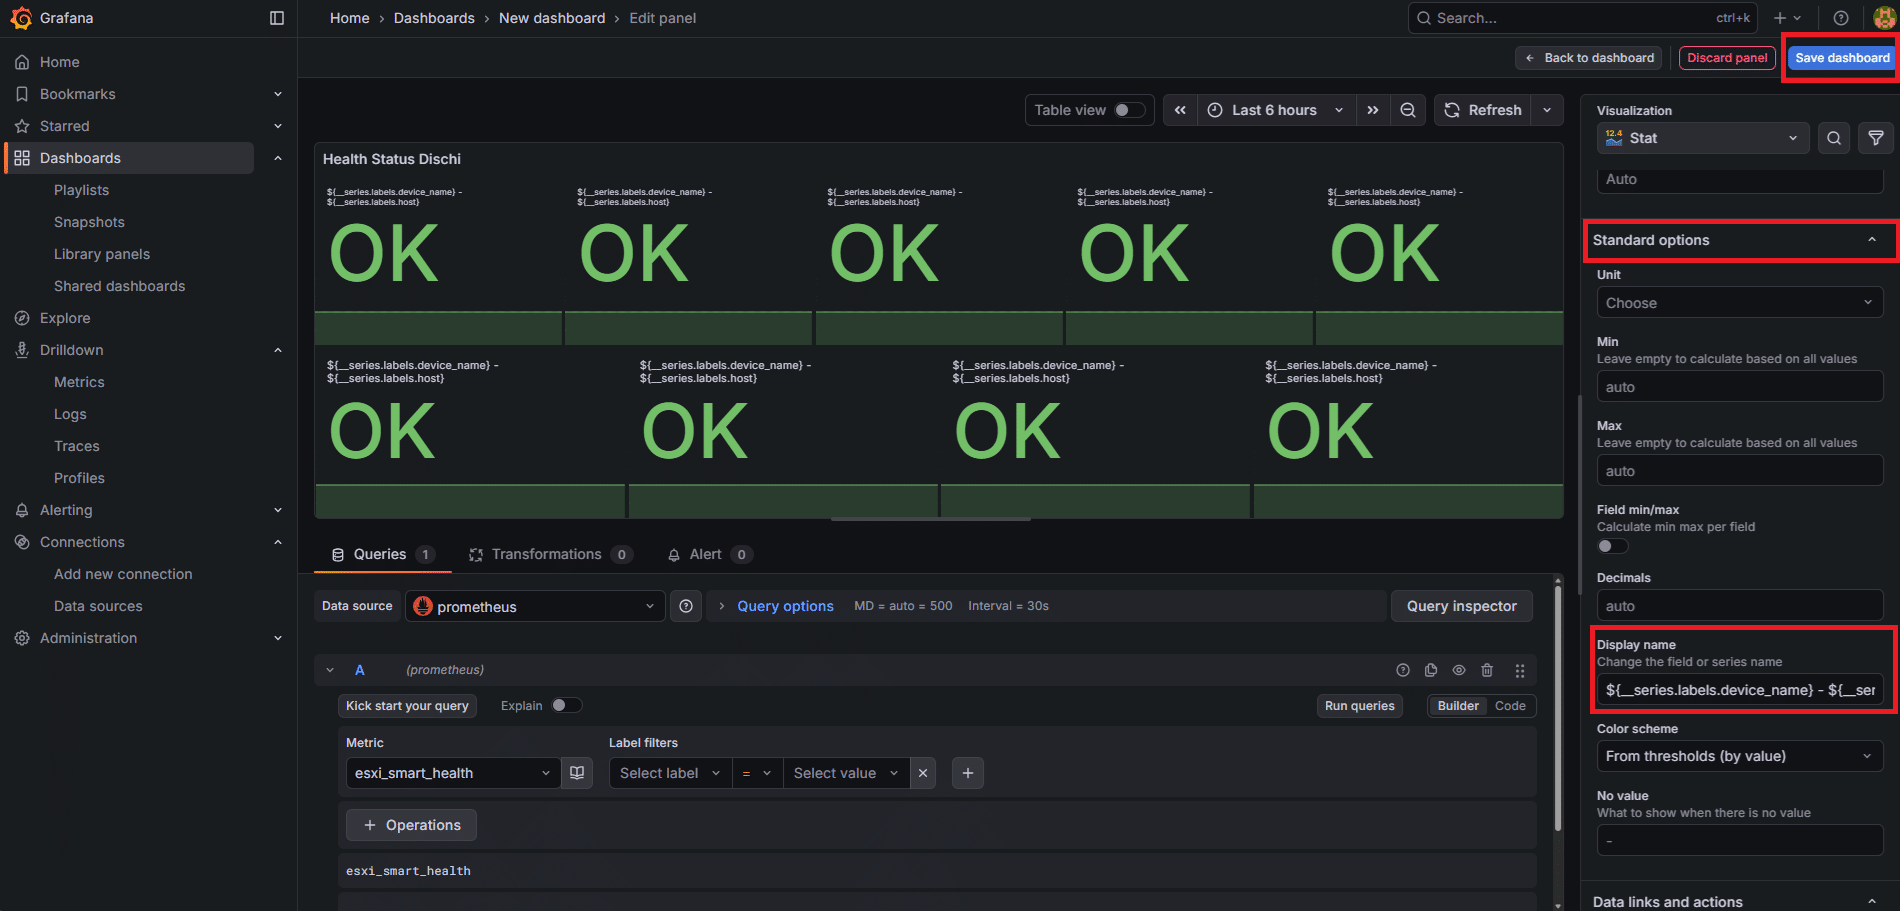
Impostare nelle Standard options → Display name (colonna destra) il seguente valore:
${__series.labels.device_name} – ${__series.labels.host}
Cliccare in alto a destra Save Dashboard
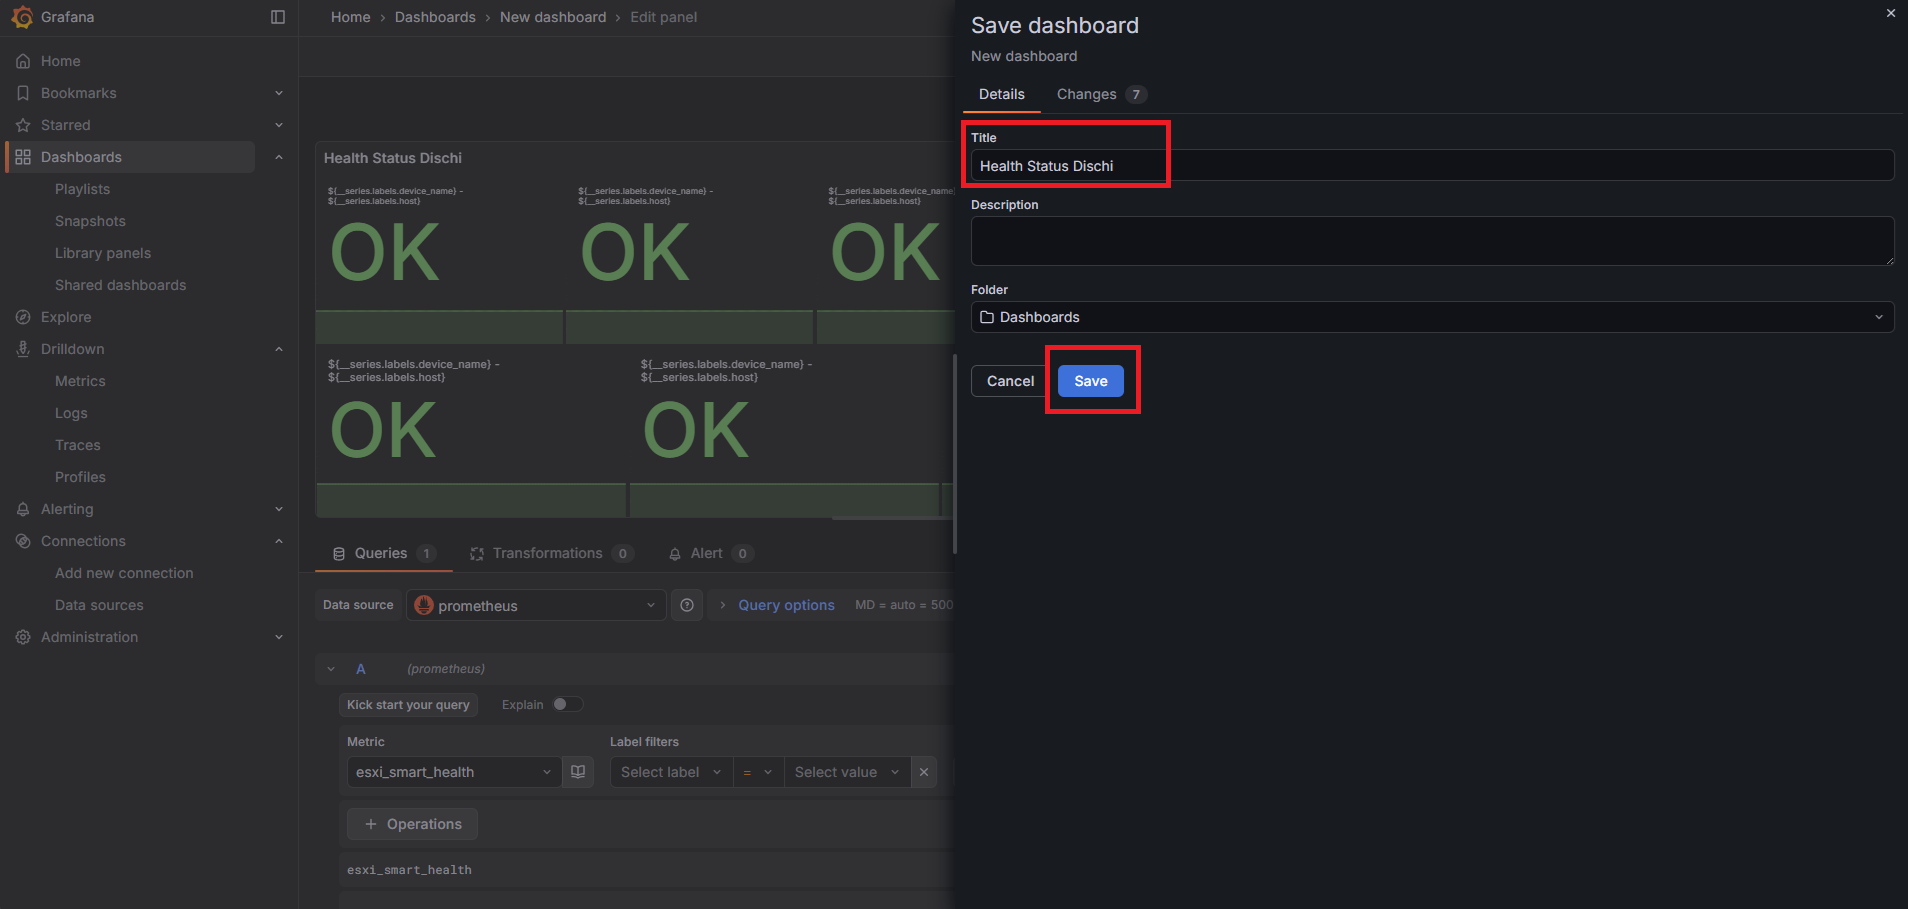
Inserire il titolo quindi cliccare Save
STEP 4 — PANNELLO 2: INVENTARIO DISCHI
Tornare alla dashboard e cliccare Add → Visualization.
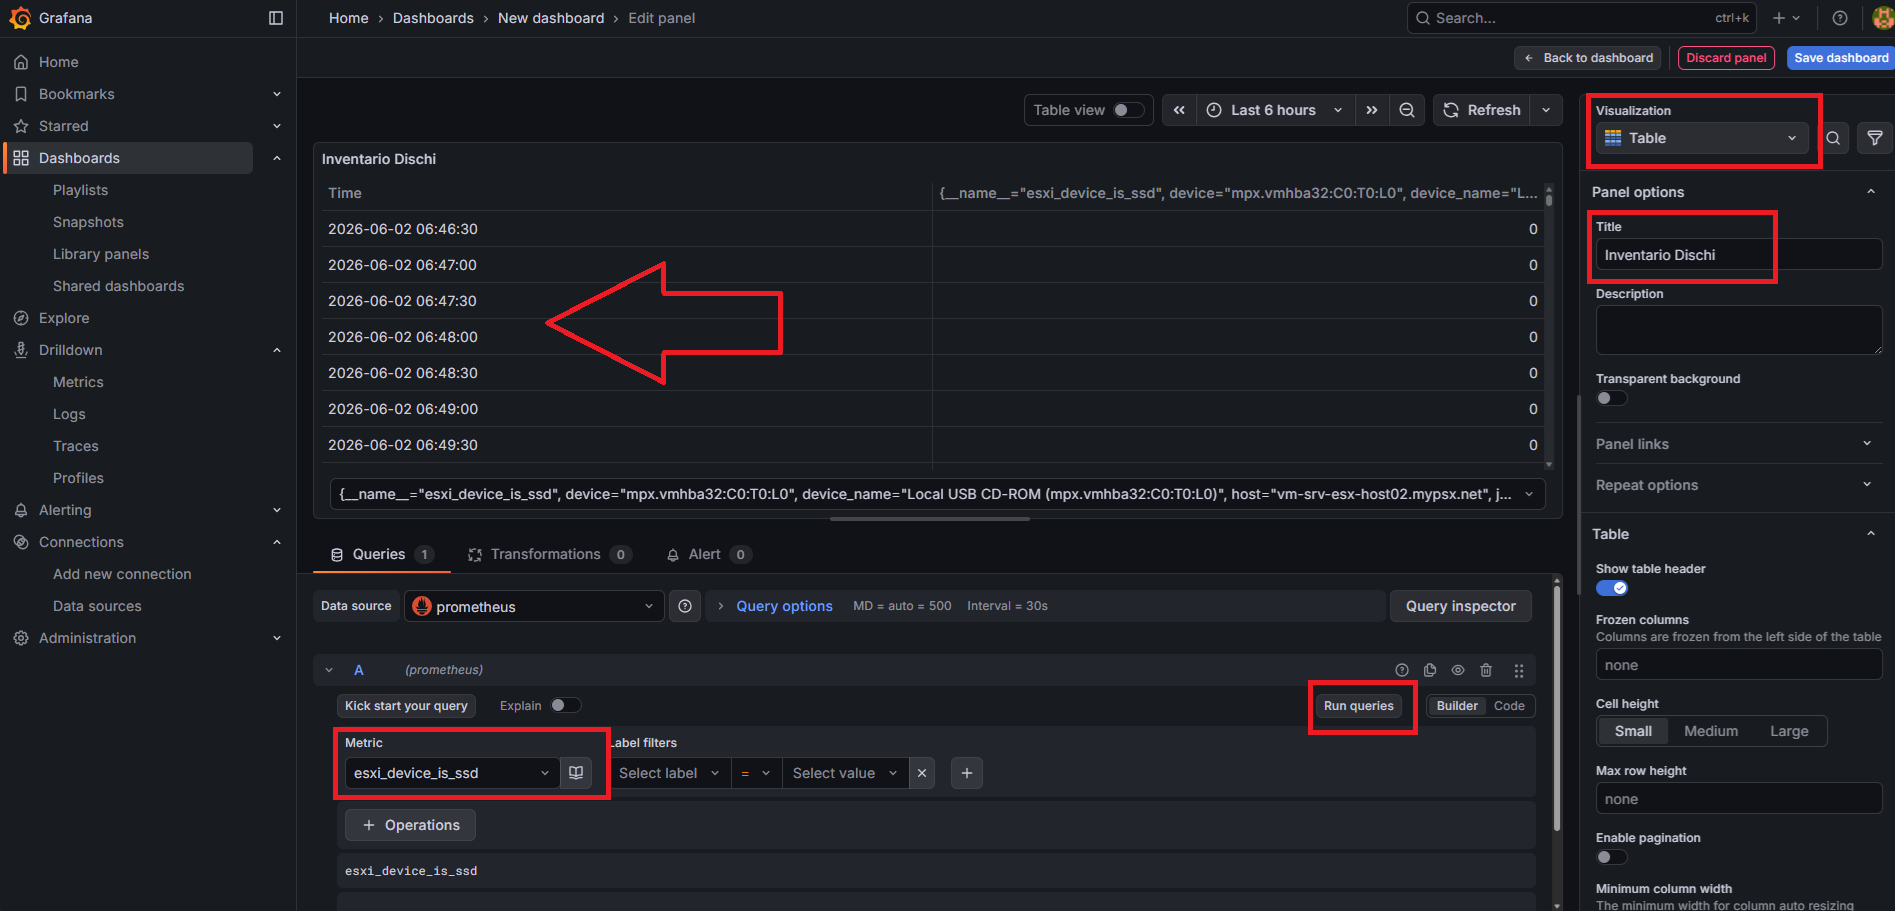
Tipo grafico: Cambiare a Table
Query: esxi_device_is_ssd
Cliccare Run queries
Titolo: Inventario Dischi
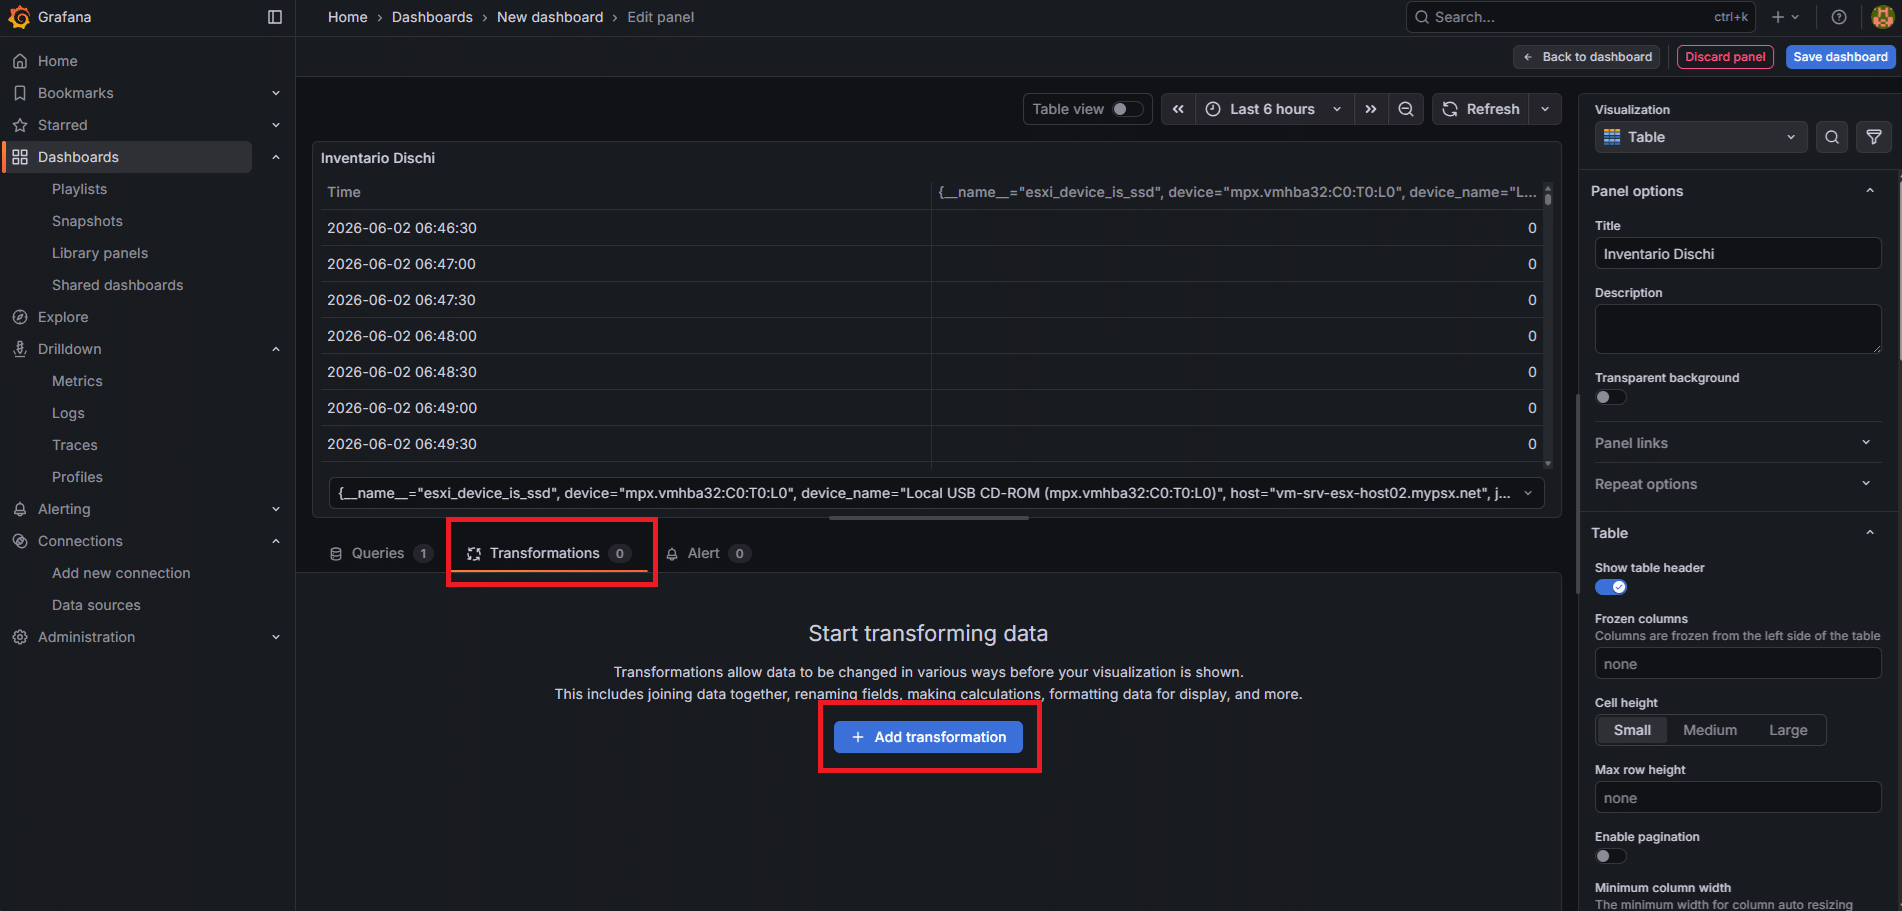
Cliccare sul tab Transformations in basso accanto a Queries:
Clicca Add transformation
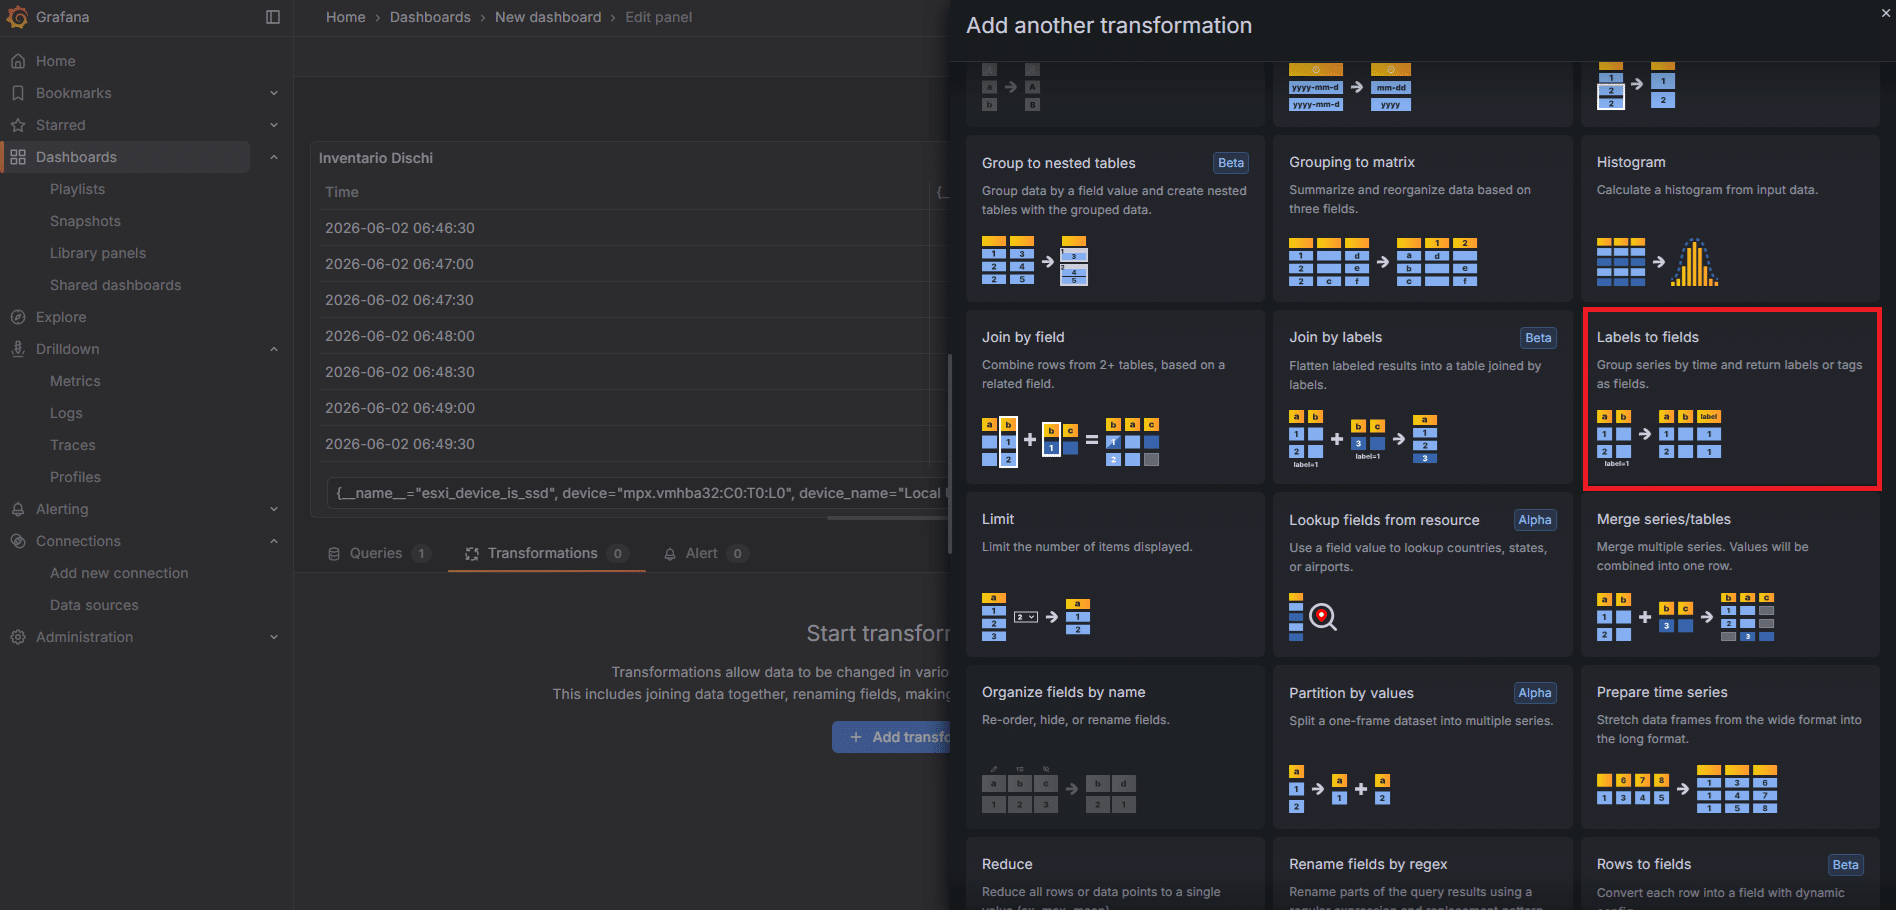
Scegliere Labels to fields
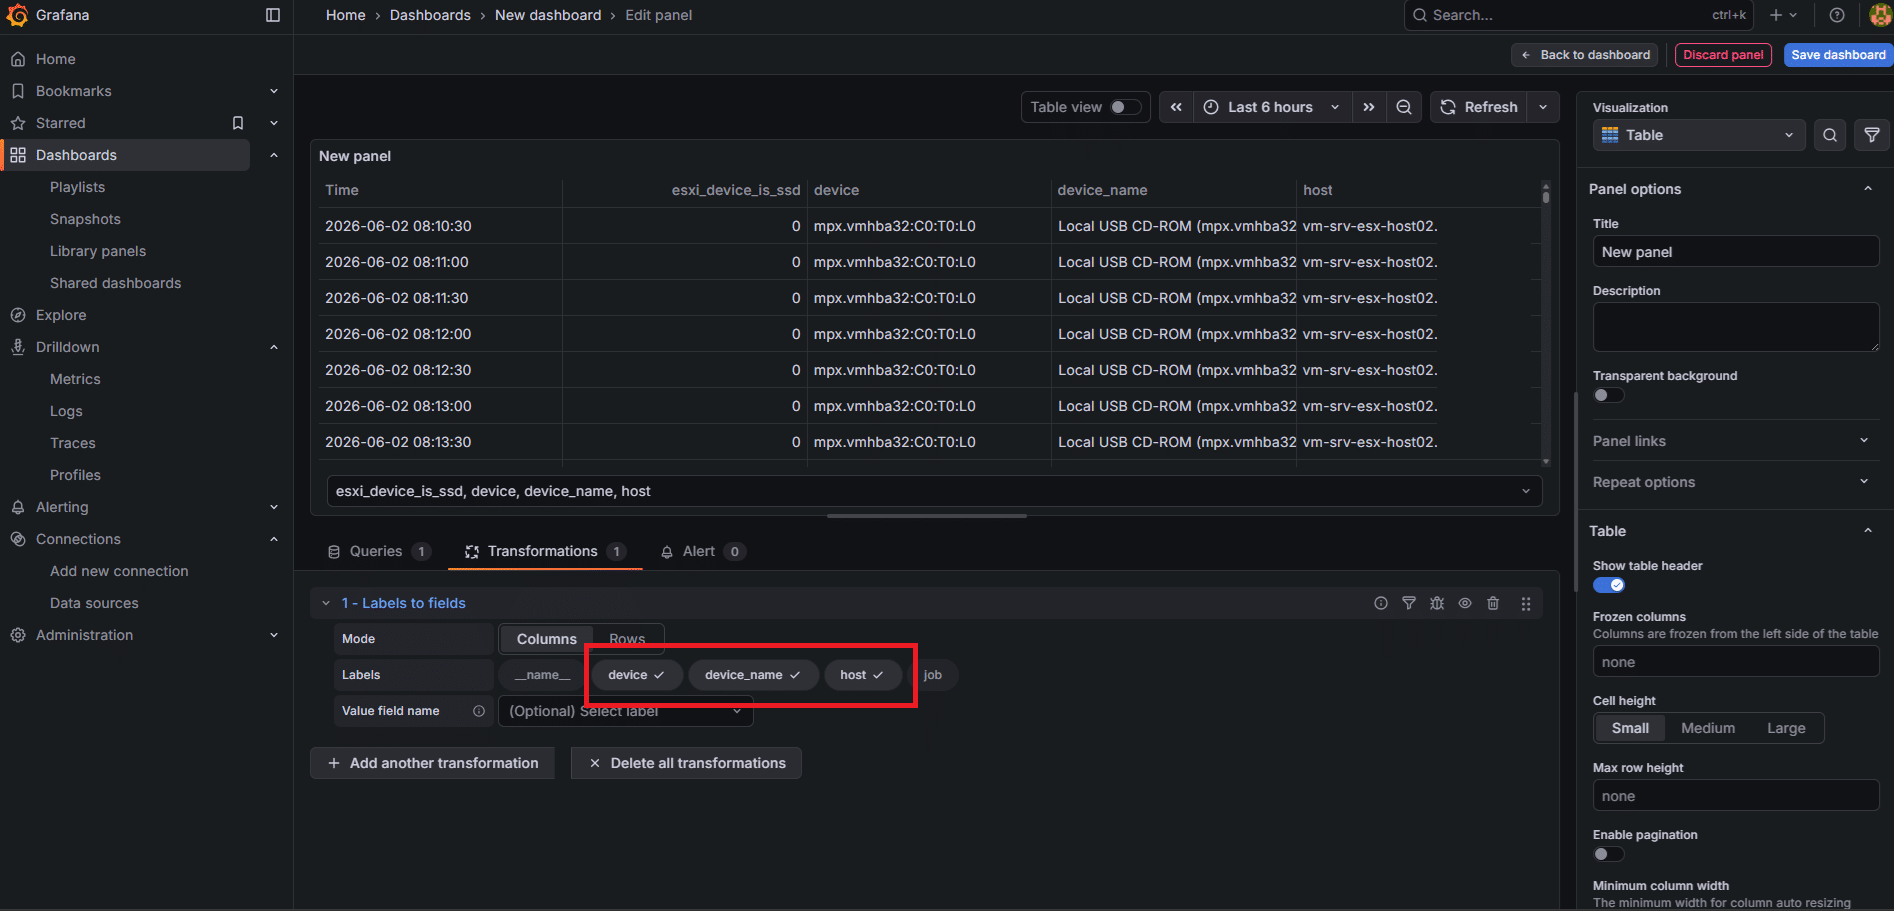
Apparirà una colonna per ogni label: host, device, device_name
Nella lista dei campi tenere: host, device_name, device
Clicca Add transformation → cerca Organize fields
Nascondere: Time, __name__, job, instance
Quindi rinominare:
host → Host
device_name → Disco
device → Device ID
Value #A → Health
Value #B → Tipo
Cliccare Apply
STEP 5 — PANNELLO 2: CONTEGGIO DISCHI OK PER HOST
Cliccare Add → Visualization
Impostare il tipo grafico in: Stat
Query: count by (host) (esxi_smart_health == 1)
Titolo: Dischi OK per host
In Standard options → Unit impostare: short
In Standard options → Display name: ${__series.labels.host}
In Thresholds impostare: Base → Verde (tutti OK è buono)
Cliccare Apply
STEP 6 — SALVATAGGIO DELLA DASHBOARD
Cliccare l’icona salva in alto a destra (o Ctrl+S)
Nome dashboard: ESXi Disk Health
Folder: puoi lasciare General
Cliccare Save
Al termine dopo varie implementazioni dovremmo visualizzare la nostra Dashoboard
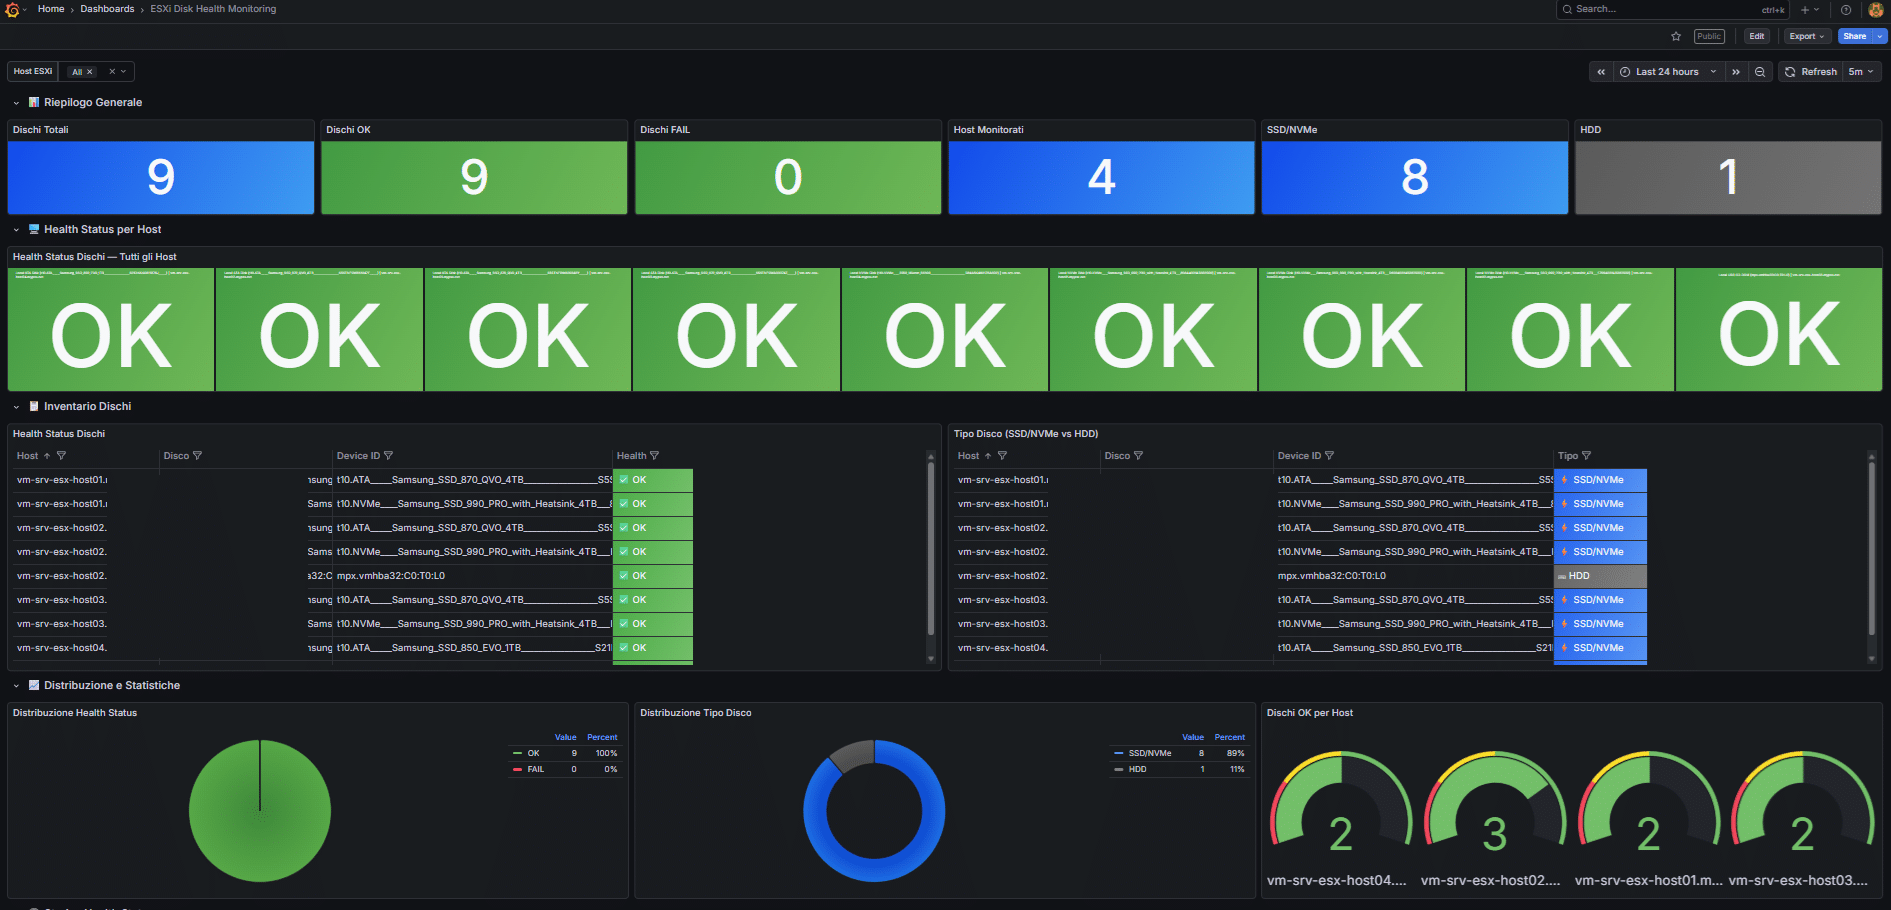
FASE 7 – JSON DASHBOARD
Di seguito il codice Json pronto per avere la Dashboard pronta:
|
0
1
2
3
4
5
6
7
8
9
10
11
12
13
14
15
16
17
18
19
20
21
22
23
24
25
26
27
28
29
30
31
32
33
34
35
36
37
38
39
40
41
42
43
44
45
46
47
48
49
50
51
52
53
54
55
56
57
58
59
60
61
62
63
64
65
66
67
68
69
70
71
72
73
74
75
76
77
78
79
80
81
82
83
84
85
86
87
88
89
90
91
92
93
94
95
96
97
98
99
100
101
102
103
104
105
106
107
108
109
110
111
112
113
114
115
116
117
118
119
120
121
122
123
124
125
126
127
128
129
130
131
132
133
134
135
136
137
138
139
140
141
142
143
144
145
146
147
148
149
150
151
152
153
154
155
156
157
158
159
160
161
162
163
164
165
166
167
168
169
170
171
172
173
174
175
176
177
178
179
180
181
182
183
184
185
186
187
188
189
190
191
192
193
194
195
196
197
198
199
200
201
202
203
204
205
206
207
208
209
210
211
212
213
214
215
216
217
218
219
220
221
222
223
224
225
226
227
228
229
230
231
232
233
234
235
236
237
238
239
240
241
242
243
244
245
246
247
248
249
250
251
252
253
254
255
256
257
258
259
260
261
262
263
264
265
266
267
268
269
270
271
272
273
274
275
276
277
278
279
280
281
282
283
284
285
286
287
288
289
290
291
292
293
294
295
296
297
298
299
300
301
302
303
304
305
306
307
308
309
310
311
312
313
314
315
316
317
318
319
320
321
322
323
324
325
326
327
328
329
330
331
332
333
334
335
336
337
338
339
340
341
342
343
344
345
346
347
348
349
350
351
352
353
354
355
356
357
358
359
360
361
362
363
364
365
366
367
368
369
370
371
372
373
374
375
376
377
378
379
380
381
382
383
384
385
386
387
388
389
390
391
392
393
394
395
396
397
398
399
400
401
402
403
404
405
406
407
408
409
410
411
412
413
414
415
416
417
418
419
420
421
422
423
424
425
426
427
428
429
430
431
432
433
434
435
436
437
438
439
440
441
442
443
444
445
446
447
448
449
450
451
452
453
454
455
456
457
458
459
460
461
462
463
464
465
466
467
468
469
470
471
472
473
474
475
476
477
478
479
480
481
482
483
484
485
486
487
488
489
490
491
492
493
494
495
496
497
498
499
500
501
502
503
504
505
506
507
508
509
510
511
512
513
514
515
516
517
518
519
520
521
522
523
524
525
526
527
528
529
530
531
532
533
534
535
536
537
538
539
540
541
542
543
544
545
546
547
548
549
550
551
552
553
554
555
556
557
558
559
560
561
562
563
564
565
566
567
568
569
570
571
572
573
574
575
576
577
578
579
580
581
582
583
584
585
586
587
588
589
590
591
592
593
594
595
596
597
598
599
600
601
602
603
604
605
606
607
608
|
{
"__inputs": [
{
"name": "DS_PROMETHEUS",
"label": "Prometheus",
"description": "",
"type": "datasource",
"pluginId": "prometheus",
"pluginName": "Prometheus"
}
],
"__elements": {},
"__requires": [
{ "type": "grafana", "id": "grafana", "name": "Grafana", "version": "10.0.0" },
{ "type": "datasource", "id": "prometheus", "name": "Prometheus", "version": "1.0.0" },
{ "type": "panel", "id": "stat", "name": "Stat", "version": "" },
{ "type": "panel", "id": "table", "name": "Table", "version": "" },
{ "type": "panel", "id": "gauge", "name": "Gauge", "version": "" },
{ "type": "panel", "id": "piechart", "name": "Pie chart", "version": "" },
{ "type": "panel", "id": "timeseries","name": "Time series","version": "" }
],
"annotations": {
"list": [
{
"builtIn": 1,
"datasource": { "type": "grafana", "uid": "-- Grafana --" },
"enable": true,
"hide": true,
"iconColor": "rgba(0, 211, 255, 1)",
"name": "Annotations & Alerts",
"type": "dashboard"
}
]
},
"description": "Monitoraggio salute dischi SSD e NVMe su host VMware ESXi tramite pyVmomi e Prometheus",
"editable": true,
"fiscalYearStartMonth": 0,
"graphTooltip": 1,
"id": null,
"links": [],
"panels": [
{
"collapsed": false,
"gridPos": { "h": 1, "w": 24, "x": 0, "y": 0 },
"id": 100,
"title": " Riepilogo Generale",
"type": "row"
},
{
"datasource": { "type": "prometheus", "uid": "${DS_PROMETHEUS}" },
"fieldConfig": {
"defaults": {
"color": { "mode": "thresholds" },
"mappings": [],
"thresholds": { "mode": "absolute", "steps": [{ "color": "blue", "value": null }] },
"unit": "short"
},
"overrides": []
},
"gridPos": { "h": 4, "w": 4, "x": 0, "y": 1 },
"id": 1,
"options": {
"colorMode": "background", "graphMode": "none", "justifyMode": "center",
"orientation": "auto",
"reduceOptions": { "calcs": ["lastNotNull"], "fields": "", "values": false },
"textMode": "auto"
},
"title": "Dischi Totali",
"type": "stat",
"targets": [{
"datasource": { "type": "prometheus", "uid": "${DS_PROMETHEUS}" },
"expr": "count(esxi_smart_health)", "instant": true, "legendFormat": "Totale", "refId": "A"
}]
},
{
"datasource": { "type": "prometheus", "uid": "${DS_PROMETHEUS}" },
"fieldConfig": {
"defaults": {
"color": { "mode": "thresholds" },
"mappings": [],
"thresholds": { "mode": "absolute", "steps": [{ "color": "green", "value": null }] },
"unit": "short"
},
"overrides": []
},
"gridPos": { "h": 4, "w": 4, "x": 4, "y": 1 },
"id": 2,
"options": {
"colorMode": "background", "graphMode": "none", "justifyMode": "center",
"orientation": "auto",
"reduceOptions": { "calcs": ["lastNotNull"], "fields": "", "values": false },
"textMode": "auto"
},
"title": "Dischi OK",
"type": "stat",
"targets": [{
"datasource": { "type": "prometheus", "uid": "${DS_PROMETHEUS}" },
"expr": "count(esxi_smart_health == 1)", "instant": true, "legendFormat": "OK", "refId": "A"
}]
},
{
"datasource": { "type": "prometheus", "uid": "${DS_PROMETHEUS}" },
"fieldConfig": {
"defaults": {
"color": { "mode": "thresholds" },
"mappings": [],
"thresholds": { "mode": "absolute", "steps": [{ "color": "green", "value": null }, { "color": "red", "value": 1 }] },
"unit": "short"
},
"overrides": []
},
"gridPos": { "h": 4, "w": 4, "x": 8, "y": 1 },
"id": 3,
"options": {
"colorMode": "background", "graphMode": "none", "justifyMode": "center",
"orientation": "auto",
"reduceOptions": { "calcs": ["lastNotNull"], "fields": "", "values": false },
"textMode": "auto"
},
"title": "Dischi FAIL",
"type": "stat",
"targets": [{
"datasource": { "type": "prometheus", "uid": "${DS_PROMETHEUS}" },
"expr": "count(esxi_smart_health == 0) or vector(0)", "instant": true, "legendFormat": "FAIL", "refId": "A"
}]
},
{
"datasource": { "type": "prometheus", "uid": "${DS_PROMETHEUS}" },
"fieldConfig": {
"defaults": {
"color": { "mode": "thresholds" },
"mappings": [],
"thresholds": { "mode": "absolute", "steps": [{ "color": "blue", "value": null }] },
"unit": "short"
},
"overrides": []
},
"gridPos": { "h": 4, "w": 4, "x": 12, "y": 1 },
"id": 4,
"options": {
"colorMode": "background", "graphMode": "none", "justifyMode": "center",
"orientation": "auto",
"reduceOptions": { "calcs": ["lastNotNull"], "fields": "", "values": false },
"textMode": "auto"
},
"title": "Host Monitorati",
"type": "stat",
"targets": [{
"datasource": { "type": "prometheus", "uid": "${DS_PROMETHEUS}" },
"expr": "count(count by (host) (esxi_smart_health))", "instant": true, "legendFormat": "Host", "refId": "A"
}]
},
{
"datasource": { "type": "prometheus", "uid": "${DS_PROMETHEUS}" },
"fieldConfig": {
"defaults": {
"color": { "mode": "thresholds" },
"mappings": [],
"thresholds": { "mode": "absolute", "steps": [{ "color": "blue", "value": null }] },
"unit": "short"
},
"overrides": []
},
"gridPos": { "h": 4, "w": 4, "x": 16, "y": 1 },
"id": 5,
"options": {
"colorMode": "background", "graphMode": "none", "justifyMode": "center",
"orientation": "auto",
"reduceOptions": { "calcs": ["lastNotNull"], "fields": "", "values": false },
"textMode": "auto"
},
"title": "SSD/NVMe",
"type": "stat",
"targets": [{
"datasource": { "type": "prometheus", "uid": "${DS_PROMETHEUS}" },
"expr": "count(esxi_device_is_ssd == 1)", "instant": true, "legendFormat": "SSD/NVMe", "refId": "A"
}]
},
{
"datasource": { "type": "prometheus", "uid": "${DS_PROMETHEUS}" },
"fieldConfig": {
"defaults": {
"color": { "mode": "thresholds" },
"mappings": [],
"thresholds": { "mode": "absolute", "steps": [{ "color": "grey", "value": null }] },
"unit": "short"
},
"overrides": []
},
"gridPos": { "h": 4, "w": 4, "x": 20, "y": 1 },
"id": 6,
"options": {
"colorMode": "background", "graphMode": "none", "justifyMode": "center",
"orientation": "auto",
"reduceOptions": { "calcs": ["lastNotNull"], "fields": "", "values": false },
"textMode": "auto"
},
"title": "HDD",
"type": "stat",
"targets": [{
"datasource": { "type": "prometheus", "uid": "${DS_PROMETHEUS}" },
"expr": "count(esxi_device_is_ssd == 0) or vector(0)", "instant": true, "legendFormat": "HDD", "refId": "A"
}]
},
{
"collapsed": false,
"gridPos": { "h": 1, "w": 24, "x": 0, "y": 5 },
"id": 101,
"title": "️ Health Status per Host",
"type": "row"
},
{
"datasource": { "type": "prometheus", "uid": "${DS_PROMETHEUS}" },
"fieldConfig": {
"defaults": {
"color": { "mode": "thresholds" },
"mappings": [
{ "options": { "0": { "color": "red", "index": 1, "text": "FAIL" }, "1": { "color": "green", "index": 0, "text": "OK" } }, "type": "value" }
],
"thresholds": { "mode": "absolute", "steps": [{ "color": "red", "value": null }, { "color": "green", "value": 1 }] },
"unit": "short"
},
"overrides": []
},
"gridPos": { "h": 6, "w": 24, "x": 0, "y": 6 },
"id": 10,
"options": {
"colorMode": "background", "graphMode": "none", "justifyMode": "center",
"orientation": "auto",
"reduceOptions": { "calcs": ["lastNotNull"], "fields": "", "values": false },
"textMode": "value_and_name"
},
"title": "Health Status Dischi — Tutti gli Host",
"type": "stat",
"targets": [{
"datasource": { "type": "prometheus", "uid": "${DS_PROMETHEUS}" },
"expr": "esxi_smart_health{host=~\"$host\"}",
"instant": true,
"legendFormat": "{{device_name}} | {{host}}",
"refId": "A"
}]
},
{
"collapsed": false,
"gridPos": { "h": 1, "w": 24, "x": 0, "y": 12 },
"id": 102,
"title": " Inventario Dischi",
"type": "row"
},
{
"datasource": { "type": "prometheus", "uid": "${DS_PROMETHEUS}" },
"fieldConfig": {
"defaults": {
"custom": {
"align": "left",
"cellOptions": { "type": "auto" },
"filterable": true,
"inspect": false
},
"mappings": [],
"thresholds": { "mode": "absolute", "steps": [{ "color": "green", "value": null }] }
},
"overrides": [
{
"matcher": { "id": "byName", "options": "Value" },
"properties": [
{ "id": "displayName", "value": "Health" },
{
"id": "mappings",
"value": [
{ "options": { "1": { "color": "green", "index": 0, "text": "✅ OK" },
"0": { "color": "red", "index": 1, "text": "❌ FAIL" } }, "type": "value" }
]
},
{ "id": "custom.cellOptions", "value": { "type": "color-background" } },
{ "id": "custom.width", "value": 120 }
]
},
{
"matcher": { "id": "byName", "options": "host" },
"properties": [
{ "id": "displayName", "value": "Host" },
{ "id": "custom.width", "value": 220 }
]
},
{
"matcher": { "id": "byName", "options": "device_name" },
"properties": [
{ "id": "displayName", "value": "Disco" },
{ "id": "custom.width", "value": 260 }
]
},
{
"matcher": { "id": "byName", "options": "device" },
"properties": [
{ "id": "displayName", "value": "Device ID" },
{ "id": "custom.width", "value": 420 }
]
},
{
"matcher": { "id": "byName", "options": "Time" },
"properties": [{ "id": "custom.hidden", "value": true }]
}
]
},
"gridPos": { "h": 10, "w": 12, "x": 0, "y": 13 },
"id": 20,
"options": {
"cellHeight": "sm",
"footer": { "countRows": false, "fields": "", "reducer": ["sum"], "show": false },
"showHeader": true,
"sortBy": [{ "desc": false, "displayName": "Host" }]
},
"title": "Health Status Dischi",
"transformations": [
{
"id": "labelsToFields",
"options": { "mode": "columns", "keepLabels": ["host", "device_name", "device"] }
},
{
"id": "organize",
"options": {
"excludeByName": { "Time": true, "__name__": true, "job": true, "instance": true },
"indexByName": { "host": 0, "device_name": 1, "device": 2, "Value": 3 },
"renameByName": {}
}
}
],
"type": "table",
"targets": [{
"datasource": { "type": "prometheus", "uid": "${DS_PROMETHEUS}" },
"expr": "esxi_smart_health{host=~\"$host\"}",
"instant": true,
"legendFormat": "",
"refId": "A",
"format": "table"
}]
},
{
"datasource": { "type": "prometheus", "uid": "${DS_PROMETHEUS}" },
"fieldConfig": {
"defaults": {
"custom": {
"align": "left",
"cellOptions": { "type": "auto" },
"filterable": true,
"inspect": false
},
"mappings": [],
"thresholds": { "mode": "absolute", "steps": [{ "color": "green", "value": null }] }
},
"overrides": [
{
"matcher": { "id": "byName", "options": "Value" },
"properties": [
{ "id": "displayName", "value": "Tipo" },
{
"id": "mappings",
"value": [
{ "options": { "1": { "color": "blue", "index": 0, "text": "⚡ SSD/NVMe" },
"0": { "color": "grey", "index": 1, "text": " HDD" } }, "type": "value" }
]
},
{ "id": "custom.cellOptions", "value": { "type": "color-background" } },
{ "id": "custom.width", "value": 140 }
]
},
{
"matcher": { "id": "byName", "options": "host" },
"properties": [
{ "id": "displayName", "value": "Host" },
{ "id": "custom.width", "value": 220 }
]
},
{
"matcher": { "id": "byName", "options": "device_name" },
"properties": [
{ "id": "displayName", "value": "Disco" },
{ "id": "custom.width", "value": 260 }
]
},
{
"matcher": { "id": "byName", "options": "device" },
"properties": [
{ "id": "displayName", "value": "Device ID" },
{ "id": "custom.width", "value": 420 }
]
},
{
"matcher": { "id": "byName", "options": "Time" },
"properties": [{ "id": "custom.hidden", "value": true }]
}
]
},
"gridPos": { "h": 10, "w": 12, "x": 12, "y": 13 },
"id": 21,
"options": {
"cellHeight": "sm",
"footer": { "countRows": false, "fields": "", "reducer": ["sum"], "show": false },
"showHeader": true,
"sortBy": [{ "desc": false, "displayName": "Host" }]
},
"title": "Tipo Disco (SSD/NVMe vs HDD)",
"transformations": [
{
"id": "labelsToFields",
"options": { "mode": "columns", "keepLabels": ["host", "device_name", "device"] }
},
{
"id": "organize",
"options": {
"excludeByName": { "Time": true, "__name__": true, "job": true, "instance": true },
"indexByName": { "host": 0, "device_name": 1, "device": 2, "Value": 3 },
"renameByName": {}
}
}
],
"type": "table",
"targets": [{
"datasource": { "type": "prometheus", "uid": "${DS_PROMETHEUS}" },
"expr": "esxi_device_is_ssd{host=~\"$host\"}",
"instant": true,
"legendFormat": "",
"refId": "A",
"format": "table"
}]
},
{
"collapsed": false,
"gridPos": { "h": 1, "w": 24, "x": 0, "y": 23 },
"id": 103,
"title": " Distribuzione e Statistiche",
"type": "row"
},
{
"datasource": { "type": "prometheus", "uid": "${DS_PROMETHEUS}" },
"fieldConfig": {
"defaults": {
"color": { "mode": "palette-classic" },
"custom": { "hideFrom": { "legend": false, "tooltip": false, "viz": false } },
"mappings": []
},
"overrides": [
{ "matcher": { "id": "byName", "options": "OK" }, "properties": [{ "id": "color", "value": { "fixedColor": "green", "mode": "fixed" } }] },
{ "matcher": { "id": "byName", "options": "FAIL" }, "properties": [{ "id": "color", "value": { "fixedColor": "red", "mode": "fixed" } }] }
]
},
"gridPos": { "h": 8, "w": 8, "x": 0, "y": 24 },
"id": 30,
"options": {
"legend": { "displayMode": "table", "placement": "right", "showLegend": true, "values": ["value", "percent"] },
"pieType": "pie",
"tooltip": { "mode": "single", "sort": "none" }
},
"title": "Distribuzione Health Status",
"type": "piechart",
"targets": [
{ "datasource": { "type": "prometheus", "uid": "${DS_PROMETHEUS}" }, "expr": "count(esxi_smart_health == 1)", "instant": true, "legendFormat": "OK", "refId": "A" },
{ "datasource": { "type": "prometheus", "uid": "${DS_PROMETHEUS}" }, "expr": "count(esxi_smart_health == 0) or vector(0)", "instant": true, "legendFormat": "FAIL", "refId": "B" }
]
},
{
"datasource": { "type": "prometheus", "uid": "${DS_PROMETHEUS}" },
"fieldConfig": {
"defaults": {
"color": { "mode": "palette-classic" },
"custom": { "hideFrom": { "legend": false, "tooltip": false, "viz": false } },
"mappings": []
},
"overrides": [
{ "matcher": { "id": "byName", "options": "SSD/NVMe" }, "properties": [{ "id": "color", "value": { "fixedColor": "blue", "mode": "fixed" } }] },
{ "matcher": { "id": "byName", "options": "HDD" }, "properties": [{ "id": "color", "value": { "fixedColor": "grey", "mode": "fixed" } }] }
]
},
"gridPos": { "h": 8, "w": 8, "x": 8, "y": 24 },
"id": 31,
"options": {
"legend": { "displayMode": "table", "placement": "right", "showLegend": true, "values": ["value", "percent"] },
"pieType": "donut",
"tooltip": { "mode": "single", "sort": "none" }
},
"title": "Distribuzione Tipo Disco",
"type": "piechart",
"targets": [
{ "datasource": { "type": "prometheus", "uid": "${DS_PROMETHEUS}" }, "expr": "count(esxi_device_is_ssd == 1)", "instant": true, "legendFormat": "SSD/NVMe", "refId": "A" },
{ "datasource": { "type": "prometheus", "uid": "${DS_PROMETHEUS}" }, "expr": "count(esxi_device_is_ssd == 0) or vector(0)", "instant": true, "legendFormat": "HDD", "refId": "B" }
]
},
{
"datasource": { "type": "prometheus", "uid": "${DS_PROMETHEUS}" },
"fieldConfig": {
"defaults": {
"color": { "mode": "thresholds" },
"mappings": [],
"max": 4, "min": 0,
"thresholds": { "mode": "absolute", "steps": [{ "color": "red", "value": null }, { "color": "yellow", "value": 1 }, { "color": "green", "value": 2 }] },
"unit": "short"
},
"overrides": []
},
"gridPos": { "h": 8, "w": 8, "x": 16, "y": 24 },
"id": 32,
"options": {
"minVizHeight": 75, "minVizWidth": 75, "orientation": "auto",
"reduceOptions": { "calcs": ["lastNotNull"], "fields": "", "values": false },
"showThresholdLabels": false, "showThresholdMarkers": true
},
"title": "Dischi OK per Host",
"type": "gauge",
"targets": [{
"datasource": { "type": "prometheus", "uid": "${DS_PROMETHEUS}" },
"expr": "count by (host) (esxi_smart_health{host=~\"$host\"} == 1)",
"instant": true, "legendFormat": "{{host}}", "refId": "A"
}]
},
{
"collapsed": false,
"gridPos": { "h": 1, "w": 24, "x": 0, "y": 32 },
"id": 104,
"title": " Storico Health Status",
"type": "row"
},
{
"datasource": { "type": "prometheus", "uid": "${DS_PROMETHEUS}" },
"fieldConfig": {
"defaults": {
"color": { "mode": "palette-classic" },
"custom": {
"axisCenteredZero": false, "axisColorMode": "text", "axisLabel": "", "axisPlacement": "auto",
"barAlignment": 0, "drawStyle": "line", "fillOpacity": 10, "gradientMode": "none",
"hideFrom": { "legend": false, "tooltip": false, "viz": false },
"insertNulls": false, "lineInterpolation": "stepAfter", "lineWidth": 2,
"pointSize": 5, "scaleDistribution": { "type": "linear" },
"showPoints": "auto", "spanNulls": false,
"stacking": { "group": "A", "mode": "none" },
"thresholdsStyle": { "mode": "off" }
},
"mappings": [], "max": 1.1, "min": -0.1,
"thresholds": { "mode": "absolute", "steps": [{ "color": "green", "value": null }] },
"unit": "short"
},
"overrides": []
},
"gridPos": { "h": 8, "w": 24, "x": 0, "y": 33 },
"id": 40,
"options": {
"legend": { "calcs": [], "displayMode": "list", "placement": "bottom", "showLegend": true },
"tooltip": { "mode": "multi", "sort": "none" }
},
"title": "Storico Health Status (1=OK, 0=FAIL)",
"type": "timeseries",
"targets": [{
"datasource": { "type": "prometheus", "uid": "${DS_PROMETHEUS}" },
"expr": "esxi_smart_health{host=~\"$host\"}",
"legendFormat": "{{device_name}} | {{host}}", "refId": "A"
}]
}
],
"refresh": "5m",
"schemaVersion": 38,
"tags": ["esxi", "vmware", "disk", "smart", "storage"],
"templating": {
"list": [
{
"current": {},
"datasource": { "type": "prometheus", "uid": "${DS_PROMETHEUS}" },
"definition": "label_values(esxi_smart_health, host)",
"hide": 0,
"includeAll": true,
"multi": true,
"name": "host",
"options": [],
"query": { "query": "label_values(esxi_smart_health, host)", "refId": "StandardVariableQuery" },
"refresh": 2,
"regex": "",
"sort": 1,
"type": "query",
"label": "Host ESXi",
"allValue": ".*"
}
]
},
"time": { "from": "now-24h", "to": "now" },
"timepicker": {},
"timezone": "browser",
"title": "ESXi Disk Health Monitoring",
"uid": "esxi-disk-health-v2",
"version": 1,
"weekStart": ""
}
|





0 commenti